Graphical Analysis 4 - collect/analyze sensor data
Sensor data-collection support:
• Vernier Go Direct® sensors - with Bluetooth® wireless technology
• Vernier Go Wireless® Heart Rate and Go Wireless Exercise Heart Rate monitors
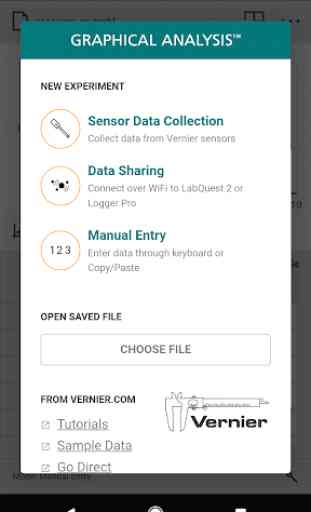
Additional experiment options:
• Data Sharing via Wi-Fi connection to LabQuest 2 or Logger Pro® 3
• Manual Entry
Note: Sensor data collection and Data Sharing require the purchase of hardware from Vernier Software & Technology. Manual entry of data can be performed without a hardware purchase. For more information on Data Sharing, visit http://www.vernier.com/css
Key Features - Data Collection
• Multi-sensor data-collection support
• Time Based, Event Based, and Drop Counting data-collection modes
• Configurable data-collection rate and duration for time-based data collection
• Optional triggering of time-based data collection based on sensor value
• Customizable unit display on supported sensors
• Sensor calibrations
• Option to zero and reverse sensor readings
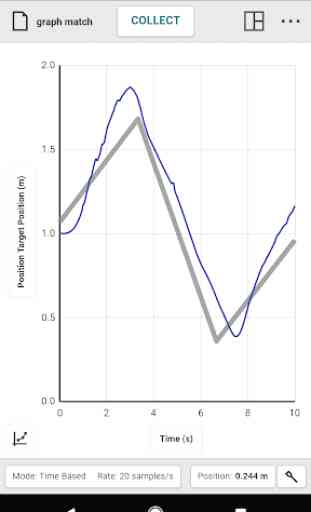
• Graph match feature for use with motion detectors
• Manual entry of data from keyboard and clipboard
Key Features - Data Analysis
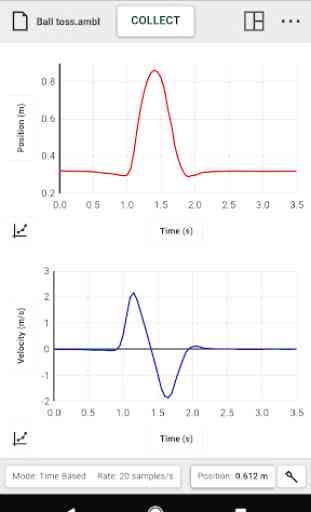
• Display one, two, or three graphs simultaneously
• View data in a table or show a graph and table side-by-side
• Draw Predictions on a graph to uncover misconceptions
• Examine, interpolate/extrapolate, and select data
• Use Tangent tool to show instantaneous rates of change of the data
• Find area under a curve using the Integral tool
• Apply Statistics calculations to find mean, min, max, and standard deviation
• Perform curve fits, including linear, quadratic, natural exponent, and more
• Add calculated columns based on existing data to linearize data or investigate related concepts
Key Features - Collaboration and Sharing
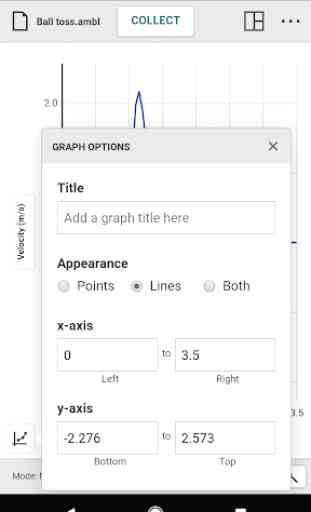
• Create text annotations and add graph titles
• Export graphs and data for printing and inclusion in lab reports
• Save files (.ambl file format) to the Cloud for exchange with Graphical Analysis 4 on other Android™ devices, Chromebooks™, Windows® and macOS® computers, and iOS devices
• Export data in .CSV format for analysis of data in spreadsheet software such as Excel, Google Sheets, and Numbers
• Adjust font sizes for easier viewing when presenting to your class
Vernier Software & Technology has over 35 years of experience in providing effective learning resources for understanding experimental data in science and math classrooms. Graphical Analysis 4 is a part of the extensive system of sensors, interfaces, and data-collection software from Vernier for science and STEM education.
Category : Education
Reviews (27)
The app works great for the most part. However, there were some issues detecting Bluetooth sensors (GoDirect Acceleration Sensor). My other major complaint lies within the data exportation function. I was exporting collected data to a csv file. The process would show was complete and the file would be present but none of the data would be written. This happened 8/10 times. With no feedback, this was incredibly frustrating when I went to do analysis on the data collected. Besides that, good job.
The problem with this app is that everything is hard to organize, hard to input data, and yes my teacher had me get this. So this is even worse because I have to desperately move things around to try and get a good screenshot, when I should be able to just zoom out from the start so I can provide the evidence I need in my work. The creators really need to make it easier to input data freely and organize their boxes better. I can't even make a line of fit without it taking up 3/4 of the screen.
Can't even plot points on the graph. Table keeps deleting my x-values. Scale does not stay what manually change it to. All around absolute trash of a user interface. Manual entry is virtually impossible and the graph only saves if you don't want it to. Then it keeps opening just THAT graph when you reopen the app despite having hit the button "Don't Save" before closing.
Feb 2022: Vernier has continued to update and improve this app. They are incredibly responsive to customer needs and feedback. Old review: This program can't import ordered pairs. I am unable to paste ordered pairs from any spreadsheet program. I am unable to open/import a spreadsheet(excel, sheets, csv) with ordered pairs. Either one of these operations would save me from having to input data.
(FIXED) I only get a blank white screen when I open the app. It does not work on my Samsung Galaxy Note 8. EDIT: I spoke with Vernier CS and was told to check my Android Webviewer and Google Chrome were both up to date, and after updating them, the app now works.
Great when it connects. But we're only getting 50-70% connection rate with different phones. I tried with the Pixel 2 XL and could not connect with this app which makes the sensor useless to me
Really bad app, glitchy. Sometimes won't even let you load your files. Other times graph won't plot points. To graph a point is so awful and glitchy that you have to exit the app. Overall absolute garbage.
App is supposed to read multiple channels from the Go Direct Electrode Amplifier, only two channels are recognized. Potential and pH. I spent a lot of money on nitrate and ammonium sensors, but cannot get them to work.
The UI is horrible. The fact zoom and scroll are the same and the only way to scroll is with both fingers is objectively bad design
Will not analyze any media I upload. You have no idea how stressful this is especially when you have a project due that's worth half of your grade.
I did a graph and saved it on a file. When I try to upload it on the app nothing pops up. I don't know what to do.
Does NOT detect Go!Temp probes. The Chrome App, however, works fine BUT will be "depreciated" SOON.
I cannot get the app to work. Will not detect the sensor.
Every time i opened it, it opened to a blank screen.
My teacher made me download this app and it is taking up all of my data this app is really terrible. :(
Impossible to use, layout is impossible to read.
Absolutely horrible, had to use in class ☹
There is no collect data button
Great learning tool. Thanks for making it free.
The app was created by muppets who cannot write there own name
This is the best app I have ever had I would use this if I had 3 minutes left in my life
Ok for science lessons but almost impossible to use.
Works beautifully with Vernier sensors!
I have to use it for school practical lesson and every app used for school is automatic 1 star :troll:
It was smudged all in the screen
looks easy to operate im looking forward this
Using touch screen to select/shade specific data intervals on the generated graphs is very difficult. Pop up menus overlay right over your graphs to where you can't even see the data you're trying to select for curve fits. Time tabs for your initial and final times on your shaded graph area end up overlaying right on top of each other (if the time interval is short) and there's no way to see the times. Additionally, you can't manually input time intervals for data graphs, you can only click/drag