Gorilla Terminal Review: The Affordable AI Bloomberg Alternative
Overview & Purpose

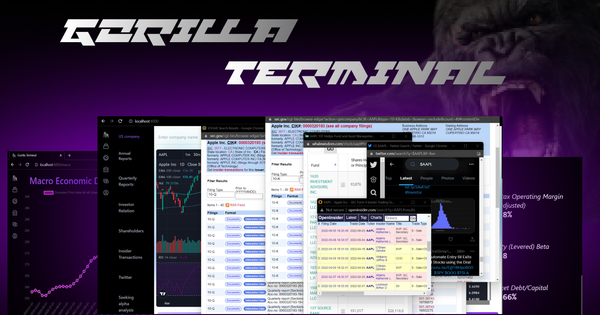
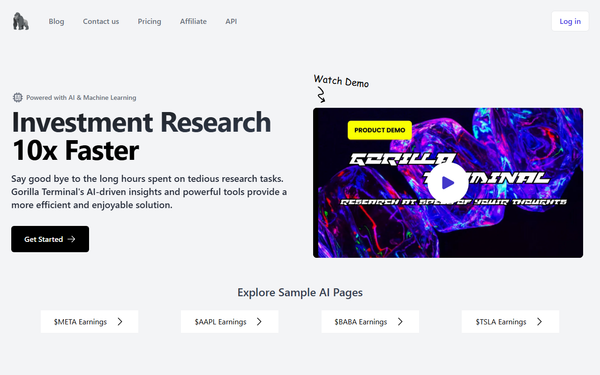
Gorilla Terminal is an AI-driven investment research platform that accelerates financial analysis by integrating advanced tools, data sources, and intuitive visualizations into a single browser-based terminal. It addresses the pain point of long, tedious research sessions by delivering macroeconomic data, real-time insights, earnings call analysis, and quantitative models at high speed—claimed to be up to 10 times faster than traditional manual methods. Primary use cases include stock screening and valuation, sector and industry comparisons, supply chain mapping, risk assessment via regression and Value at Risk (VaR) models, portfolio optimization, and monitoring live news and financial statements for informed buy/sell/hold decisions.
The tool primarily targets retail investors, professional traders, research analysts, investment managers, financial advisors, and C-suite executives who need sophisticated analysis without the expense or complexity of enterprise-grade terminals like Bloomberg. It democratizes access to professional-grade research for both beginners seeking simplicity and experienced users requiring depth, with a focus on equity markets, macro trends, and alternative data.
Key Features & Capabilities
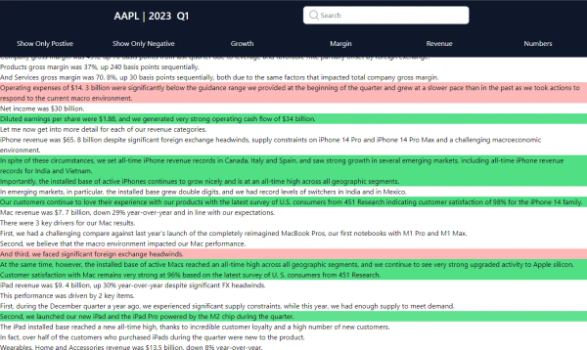
Core functionality revolves around a powerful search bar that pulls up comprehensive stock profiles, paired with an intuitive dashboard displaying charts (including pre-built indicators like 100- and 200-day EMAs and RSI), company overviews, market cap data, sector comparisons, and one-click access to SEC filings (10-Ks, 10-Qs). Standout AI capabilities include sentiment analysis of earnings calls, predictive insights, and automated summarization of financial statements, revenue growth, and margins.
Additional differentiated features include:
- Rich macroeconomic data and economic calendars.
- Industry intelligence and sector overviews with average benchmarks for valuation.
- Supply chain analysis for understanding operational dependencies.
- Regression analysis and Value at Risk (VaR) modeling for quantitative risk management.
- Real-time news feeds and hedge fund reports/letters.
- Terminal-style interface with customizable widgets for watchlists, alerts, and data blending.
These elements set Gorilla Terminal apart from basic stock screeners or free tools by combining AI automation with professional quant techniques in an affordable package. It emphasizes real-time updates and global/international market coverage, including alternative data sources.
Limitations include potentially shallower historical data depth compared to legacy platforms like Bloomberg or Refinitiv, possible gaps in coverage for obscure stocks or sectors, and heavy reliance on AI that may occasionally produce inaccuracies if underlying data sources have limitations. There is no dedicated mobile app (web-based only), and advanced API access appears limited to higher-tier plans.

User Experience
Gorilla Terminal boasts a low learning curve thanks to its clean, modern interface designed for quick navigation. The dashboard layout is straightforward: a dominant search bar at the top, central charts with technical indicators, left-side panels for key company metrics and overviews, and right-side quick links to reports and filings—enabling users to gather insights in seconds without switching tabs or tools. The terminal-style design feels familiar to finance professionals while remaining accessible to retail users.
Interface quality is consistently praised as intuitive and visually appealing, with responsive elements and pre-configured useful views that save time. Documentation is available via the official learn.gorillaterminal.com blog, including basic guides, though it is not exhaustive. Support resources include responsive customer service noted in some reviews, but public forums or extensive knowledge bases appear limited. Overall, the experience prioritizes efficiency and enjoyment over overwhelming complexity.
Performance & Reliability
The platform delivers fast query responses and real-time data updates, aligning with its promise of streamlined research. AI-driven features like earnings analysis and predictive modeling process information efficiently, reducing hours of manual work to minutes.
Known issues are relatively minor and typical for a newer AI fintech tool: occasional bugs or brief downtime during updates, potential AI hallucinations if data inputs are imperfect, and reports of limited depth in very long historical datasets. User sentiment is generally positive with few widespread complaints; the Tekpon user score stands at 3.8/5 based on aggregated chatter and reviews as of April 2026. No major reliability scandals or outages were prominent in public discussions, though coverage and accuracy concerns exist for niche use cases.
Pricing & Value
Gorilla Terminal operates on a paid subscription model with no full free tier, but offers an accessible entry point via a 7-day Pass at $9.99 (one-time payment with unlimited searches). The Pro plan is priced at $29 per month (discounted from a regular $49), providing unlimited searches, full macro data access, and all quantitative tools. The Teams plan costs $99 per month (discounted from $199) for collaborative features and higher usage. Some sources reference tiered search/credit limits on lower plans or enterprise custom quotes, but core access is generous even at entry levels.
Value proposition is strong as an affordable Bloomberg-style alternative, especially for individual or small-team investors who gain professional-grade AI and analytics without five-figure annual fees. It outperforms fragmented free tools in integration and speed, though power users needing exhaustive historical archives or on-premise solutions may find it less comprehensive than premium incumbents.
Practical Tutorial
Official documentation provides a basic dashboard walkthrough (last updated around 2022), supplemented by YouTube demos showing live usage. Here is a step-by-step tutorial for a common task—analyzing a stock for investment potential (e.g., Apple Inc., ticker: AAPL)—created from official descriptions and feature overviews:
-
Sign up and access the platform: Visit gorillaterminal.com, create an account, and start with the 7-day Pass or log into a Pro plan. You land directly on the main dashboard.
-
Perform an advanced search: Type “AAPL” (or any ticker/company name) into the prominent top search bar. The system instantly loads the full profile.
-
Review the core dashboard: Examine the central stock chart with overlaid 100- and 200-day EMAs (to identify trends) and RSI indicator (for overbought/oversold signals). Check left-panel metrics like current market cap, shares outstanding, and key fundamentals. Read the company overview summary below the chart.
-
Dive into sector and valuation context: Scroll to the sector analysis section for industry-average benchmarks (e.g., P/E, margins) to compare AAPL’s valuation. Use one-click links on the right panel to pull up the latest 10-K, 10-Q, or other SEC filings.
-
Leverage AI and advanced tools: Trigger AI earnings call analysis for sentiment scores and key takeaways. Explore Industry Intelligence for peer comparisons, Macro Data for broader economic context affecting tech stocks, or run Supply Chain Analysis to map suppliers. For quant work, access Regression Analysis or Value at Risk (VaR) models to simulate portfolio risk.
-
Monitor news and export insights: Review the integrated real-time news feed and hedge reports. Export charts, summaries, or data for further analysis or sharing.
-
Iterate or save: Add to a watchlist, set alerts, or refine searches via the Explore tab for deeper industry intelligence.
For the full official guide, visit https://learn.gorillaterminal.com/blog/tutorial/how-to-use-gorilla-terminal. YouTube videos such as “AI powered investment terminal Demo” provide visual demonstrations of these steps in action.
Final Verdict
Gorilla Terminal earns a solid 4.2 out of 5 stars. It excels as a modern, AI-enhanced research hub that makes professional-grade analysis accessible and efficient for everyday investors.
Who should use this tool: Retail investors, independent analysts, and small teams who want Bloomberg-like power at a fraction of the cost, especially those frustrated by fragmented free tools or manual spreadsheets. It shines for users prioritizing speed, AI insights, and an all-in-one dashboard.
Who should avoid this tool: Institutional users requiring ultra-deep historical datasets, mobile-native access, or mission-critical uptime guarantees; absolute beginners overwhelmed by quant features; or those on very tight budgets unwilling to commit even to the low monthly fee.
One-sentence recommendation: If you’re tired of tedious research and want an affordable AI-powered terminal that puts macro data, supply chain maps, and earnings insights at your fingertips, Gorilla Terminal is a smart, future-facing choice worth trying with the cheap 7-day pass.