acoustic frequencies
Buttons arranged on the top:
Low: Low frequency resolution, for fast responsefrequency resolution approx. 15.6 Hz
Med: Medium frequency resolution (only available in PRO-version)frequency resolution approx. 3.9 Hz
High: High frequency resolution (only available in PRO-version)frequency resolution approx. 1.0 Hz
"Ultra high Frequency Resolution" --> see below
Stop: Stops the measurement
Exit: Terminates the APP
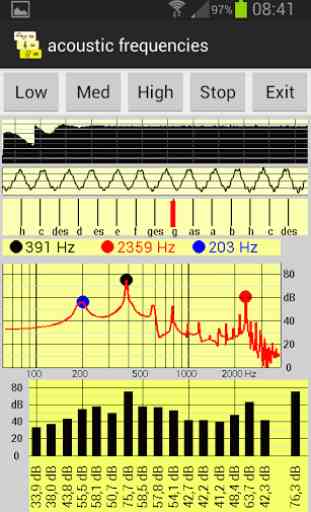
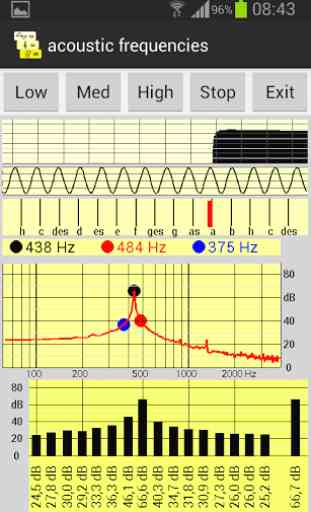
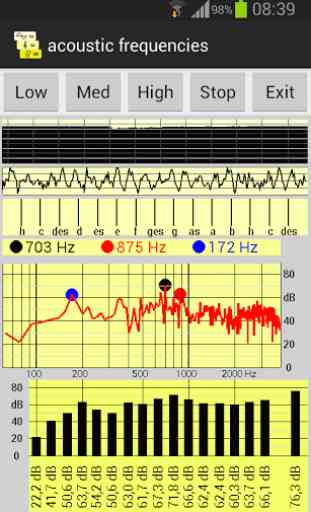
Description of the graphics (from top to bottom):1st graphic with sound level trend:Sound level trend of the last 12 seconds, scaling from 0 dB to 90 dB.
By wiping across the 1st graphic (wiping always from bottom left to top right over the relevant graphic) the numerical current value is displayed.
2nd graphic with sound pressure in function of time
3rd graphic for tone identification:If a clear tone within the frequency spectrum can be determined, the tone will be displayed with a red bar.
4th graphic with numerical peak-frequency and frequency spectrum:The numerical frequencies of the three highest peaks will be displayed. For better reading you can stop the measurement with the "Stop"-button.
5th graphic third octave band analysis:For acoustic assessments the third octave spectrum is used. The relevant frequency range from 100 Hz (limited due to the frequency response of the internal microphone) to 3150 Hz (limited due to the sampling frequency) is displayed. Only available in PRO-version: The frequency response of the internal microphone was calibrated in a diffuse sound field to a reference device. This calibration has been performed on a Samsung Galaxy S2. The displayed third octave dB-values include this correction and the A-weighting.
Other implemented wiping gestures:
Ultra high frequency resolution (only available in PRO-version):
By wiping across the 4th graphic (wiping always from bottom left to top right over the relevant graphic) an ultra-high frequency resolution will be activated, frequency resolution approx. 0.5 Hz.
Higher integration time (only available in PRO-version):By wiping across the 5th graphic (wiping always from bottom left to top right over the relevant graphic) the averaging time of the displayed third octave values is increased by a factor of 5.
Show internal diagnostic data:By wiping across the complete display (wiping always from bottom left to top right) internal data is displayed in the lower part of the display.
For more details:http://www.hs-koblenz.de/profile/kroeber/
Keywords: acoustic, frequency, tone detection, frequency analysis, third octave analysis, dBA, FFT
Category : Music & Audio
Reviews (5)
Great graphical layout. Exactly the tools I have needed. I am using this to analyze natural sounds to build synth patches. Works extremely well on my Samsung Core Prime. I plan to get the pro version after a few more tests. Thank you!
Can't any of these tools measure Hertz accurately
Freq counter makes finding feedback freq easy. Single page display = see everything at a glance. Prob looks better on tablet than my smartphone. ldeas: 1) Do not require a swipe to get SPL to appear at right end of SPL histogram. Just put it there because swipe often no worky. 2) Put Y-axis labels on SPL histogram. 3) Make the 1/3 oct bands cover 1 second window.
I cannot tell if it's useful unless I spend money for the pro version. Stupid, you lost a sell.
No solo option I mean to choose every single graph to screen