Aspectra mini
Purpose of these applications is to observe, display and analyze the spectrum of observed light
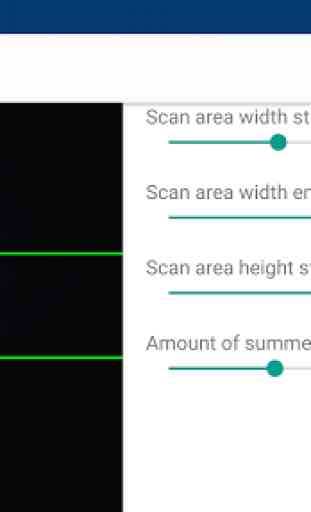
Aspectra mini is the base application in Aspectra system.
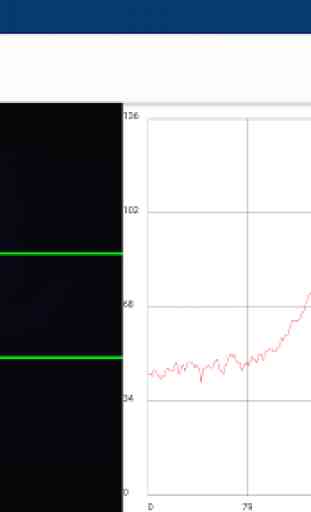
The Android device, with additional low cost spectrometer, can be used to observe the spectrum of light. Spectrum is shown as intensity plot. Every plot can be saved for the future analyze with another applications: Aspectra viewer (explorer for spectra) Aspectra analyzer (editor for spectra).
Possible applications:
teaching spectroscopy
chemical analyze
distance measurement
control of LED light source color
astral spectroscopy
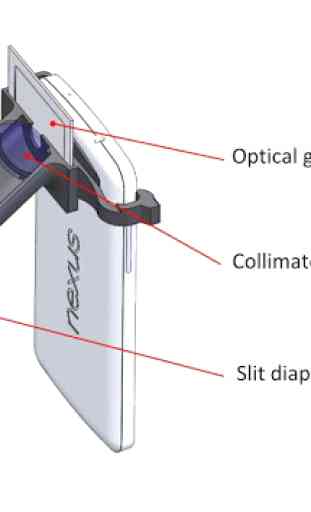
To see the spectrometer construction's details, visit my web page: www.jandrotek.de
The detail and some help can be find at https://www.jandrotek.de/support/aspectra-technical-concept/
Category : Education
Reviews (21)
Best app to analyse the spectrum of visible light. It work properly but the value of wavelength and intensity do not mach with results. But anyway only one real app for spectrum analysing on android.
Great app, but isn't able to open the saved spectra on my device. would be nice if one could calibrate as well and show colors in the graph. Hope work continues ;)
Meaningless results. -Autscale makes readings impossible to digest. -Results for the primary colours are more or less the same. -Its not measuring the wavelength or colour.
Difficult to use app! I have two types of black lights, both supposedly under 400 nm.... Showing higher wavelength
this is a great start. I now understand how app works. I see 'peaks'. now I just have to build the spectroscope part(slit and grating)
Very good among such little available App. Wish have colored trace with X scale
this is a histogram, not a spectrum analyser!
Nothing can be read. Text to small
Another brilliant idiot. Can't read the output.
Thank you for the app, wish i could pay you
Does not show you the color spectrum.
This app installed itself without my knowledge
nice app nut not what i wanted
A lot of rubbish.
It does the job
Doesn't tell you squat
This uses the phone camera the others I tryed needed a camera
Quite interesting application. Didn't realise at first it reads the data of a real physical spectroscope.
I don't think this is measuring the light spectrum but rather it seems to be only measuring light intensity
Thanks, just what i needed to test my uv lights
I have been experimenting with having this app. approximate a PAR Meter. Assuming a PAR meter reads energy in the 400nm to 700nm range,, this app shows you the energy spectrum from about 200 to 800nm, so it shows you pretty clearly what frequency your light source is emitting. My next task is to find the correct spectrum and balance of color that makes up the perfect PAR value balance.