Barometer Monitor
v1.4: new custom settings, cleaned up the UIv1.3: graphic improvements, bugfixesv1.2: added inHg measure unit, bugfixingv1.1 export pressure values via email as CSV file
Category : Weather
Reviews (23)
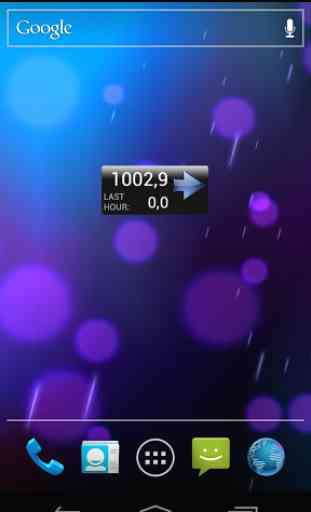
The best one compared to all the other barometer apps out there! Just add options to your widget like changing its colors, transperancy, etc. and implement immediate warnings on too quick preassure changes and you could go commercial. Really. I'd buy it.
I have severe back pain & use this when my pain kicks up to see if the pressure is dropping so I know what the cause is. Also get migraines (that can last up to 4 days) when the pressure shoots back up sometimes, so again use this to confirm if that may be the cause. Also keep in mind when driving, you will see fluctuations in the pressure due to your altitude rising & dropping (same as in aircraft). So if you drive to work & see the pressure drop every time on your way, your work is at a higher altitude.
I have a rare brain disease & symptoms (headache, nausea, etc) get substantially worse with drops in barometric pressure even though I have 2 shunts. With this app, I have literally been able to go in & compare with my journal the exact moment the barometric pressure drops! I love the graph too...you can widen it & get even more info or just leave it for the *big picture*. MANY thanks to the developer from myself & others who like me literally live by changes in the weather pressures. :o)
Logs barometer readings nicely with useful settings and an very nicely done graph that scales automatically and allows you to touch alter it. I have it running at max and haven't noticed any extra drain on the battery.
The presure reading remains the same. Doesnt work on my samsung galaxy note 4
Install and forget, this app runs quietly in the background. Sometimes seems to lose all accumulated data :-(
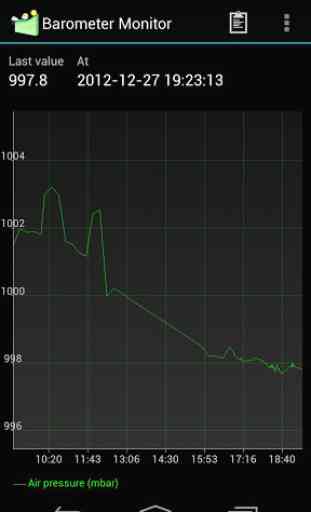
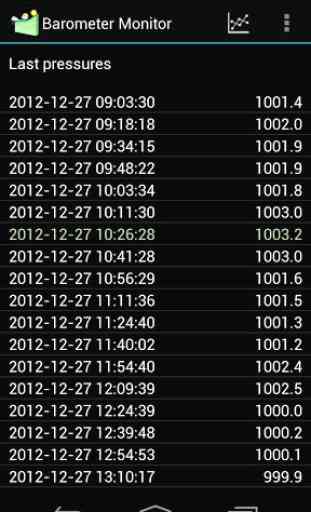
You can a have a barometric pressure running record presented as a graph or a table. It would be nice if the timescale shown on the graph really represented the selected timescale. It would be even nicer to be able to calibrate off known local elevations. But I use the app every day on my boat. Thanks. Nexus 5, 6.0.1
Trying to figure out the timescale on the graph drives me crazy. There are just times and no dates. Otherwise, it works fine.
Seems to work ok, but the bizarre annotation of the x-axis makes it pretty much useless. No dates, just seemingly random times of day stretching back a week. Also, it really could do with longer than a week as a maximum display period.
I absolutely love this app but something clears the whole history every 2-3 days. If that's fixed I will absolutely give a five star.
Excellent app and pretty accurate. Unfortunately it causes the phone sensors to fail, initially the phone is fine then after a random amount of time it will stop autorotating, curable with a reboot. Most inconvenient!
Great. Just needs the x-axis graph lines to be at logical intervals (like each midnight for example)
App works great and all, BUT only suggestion i wpuld love to see added is to be able to choose the background and graph line colour, dark green on a black background and then go outside all you see is a black screen.
I wish it could filter out or allow you to edit out liers.
Puts a barograph in your pocket! Very easy to use, clear and ergonomic display, but just one more feature would greatly increase its value: a storm alert function.
Please add the feature to display units in hPa. METAR information gives atmospheric pressure in that unit. It would be really helpful. Thanks in advance!
Perfect. Working great in mine Note 2. Can be more perfect if the intervals time can be set to the minimal interval from sensor and maybe a widget with graphs. Nothing more is needed. Thank you.
Simple and easy, does what it should. Very nice and useful. I would like to see some improvements like setting min and max for grid values, marks for days in grid view, ability to change the length of time for trend on widget. Some simple improvements and it's five stars!
I like the app but I had to uninstall it after I found that it was causing the accelerometer and other sensors to stop working on my Nexus 5 (4.4. and 4.4.1). It meant screen auto-rotate would stop rotating. Reboot fixes the sensors for a while but I had to uninstall to stop the bug coming back.
I'd like to see two curves. The absolute pressure, as now. And a second one, displaying pressure at sea level. (My device knows its elevation.) When walking up the hill, I need to see if the pressure fall is merely due to my elevation, of if a storm is coming. The latter is shown on the sea level curve.
Thank you for not bombarding this useful barometer app with hideous, insulting ads.
The data listing is functioning fine but there is no visible plot line displayed on the graph despite a lengthy data file. Google Nexus 4.
Needs a way to delete or automatically drop rouge high or low readings. Also I start with the graph showing 7 days of data and I would like to see more meaningful intervals and labels along the x axis. The x axis currently makes 7 days data look like it's less than 1 day :-( Just one star for not fixing such an obvious problem.