Blood Pressure Diary
Control high blood pressure (i.e., Hypertension) with our app!
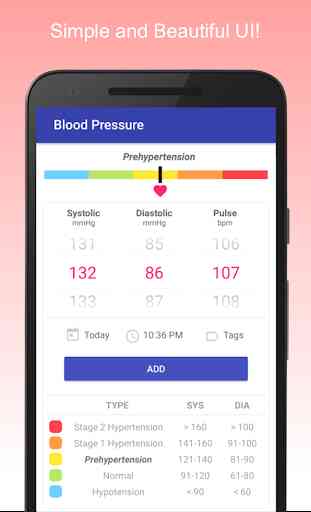
Simple and Easy to use
1. You can easily log and track systolic, diastolic and pulse by just swiping your finger
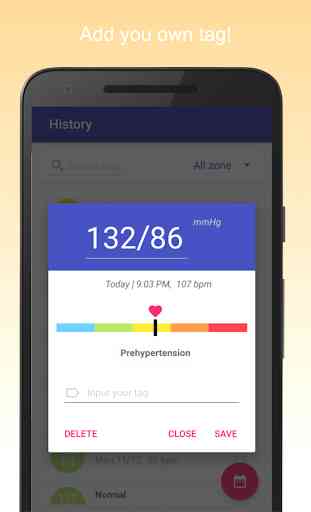
2. You can easily add your tags (e.g., irregular heartbeat, cuff location like left/right arms, seated/reclined)
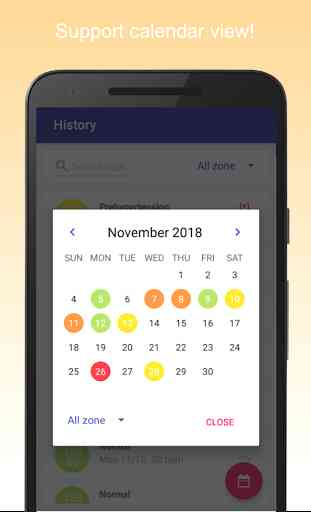
3. You can easily search your data (e.g., by date, tags, and bloodpressure zones)
Fully integrate with blood pressure zones
1. Automatically calculate bloodpressure zone
2. Support all blood pressure zones (i.e., Stage 1 and 2 Hypertension, Prehypertension, Normal, Hypotension)
3. Helpful to monitor and control your blood pressure and health
4. Easy-to-use for BP monitoring and tracking app
It’s ALL FREE
1. No restrictive feature (e.g., unlimited csv export)
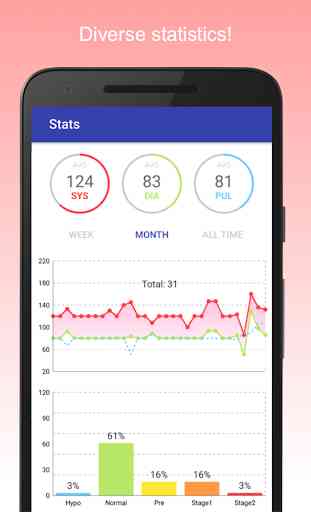
Beautiful material UIs
1. Statistics with graphs and charts (e.g., average, minimum, maximum)
2. Interactive UI for blood pressure zones
3. Simple, but very effective UI
Support auto backup (> Android 6.0) and free csv export
1. Send your bloodpressure data to your physician or doctor
2. Also record heartrate and heartbeat
* Blood pressure (BP) monitoring/tracking and heart rate are very important for health. You can start managing your bloodpressure and heartrate now by using our diary app, especially high bloodpressure or low blood pressure patients.
* According to American Heart Association (AHA), normal range of blood pressure are Systolic 91 ~ 120 mmHg and Diastolic 61 ~ 80 mmHg. Please enjoy our blood pressure log and tracker app.
* We'd appreciate your valuable feedback. Please, report bugs or request features to [email protected].
Category : Medical
Reviews (20)
Simple to use, very user friendly. No complex settings, just input your readings and save. Suggestion : in the stats page, show a band for where the "normal" range is so that it's easy to see if a reading went above or below normal. Thanks for a great app. (",)
Quick and easy blood pressure/pulse tracker. The "tags" act more as a notes section, which works well for me as I need it to show patterns of symptoms. I deducted a star for the nagging "Rate us" screen. It popped up twice in 5 minutes for me. I don't have a problem rating something, but let me look at the program a bit first please. Other than that, being only 10 minutes into the program, it seems like a decent program. Will come back and edit if I find stuff I dislike.
Easy to use, nice layout as well. Pretty happy so far. The stats function could be improved though. Now it only shows the average of week/month/all time, but it would be much more helpful if I could see the change/transition of the BP over time with dates written on the horizontal axis. It would also be much more helpful if I can choose/filter the time frame (morning/evening) and see the differences between morning and evening stats.
Simple and easy to use, could really do with custom tags being added to list so there's no need to type it every time. Also the backup feature seems to always throw an error stating that WiFi is not available, even though connected.
Very good basic diary app. Some ads, but nothing major. I'd like the ability to enter three readings and for an average of these to be plotted, rather than all three, and it would be nice if the data was plotted to reflect the actual time interval between readings rather than just regularly spaced. That said you can export the data as a csv file so could do that yourself in excel easily enough. It's hard to complain about a free app really.
Really easy and to the point! Great way to document your blood pressure! The stats give a good idea to what zone your blood pressure is in by percentages but I wish there was a day to day, week by week , month by month graph to show ups and downs to identify patterns. Also, there is a very handy feature, you can email yourself the data! Love it!!❤
Very easy to use app. The tags & notes are excellent. I gave it 4 stars because I had 2 issues. 1st I didn't see a way to just save the log to your device. So I had to email it to my self. And 2nd When you export the CSV file There is no date range options . So It gives you the entire history again. I upload my file to my doctor's Show every time I have to send all of the old stuff with the new stuff. I would like a way to just send the newest data that I have not already sent
Very simple to use. I like that it allows you to add tags to a record like "just exercised", so you can read them later. Has ads, but they are out of the way and not a nuisance. The history chart is very useful, showing how much time spent in Normal, Pre-hypertension, Stage 1 Hypertension etc. ranges. Would recommend this program!
Ok app, could be improved and made a bit more user friendly. 1. When adding a tag the option is to "save" or cancel. This is misleading and should be changed to "ok". Strangely when adding date or time the option is "ok" not save. 2. To add a reading, you tap the + icon at bottom left to add a new reading. The large blue "Add" button is actually a save button and should be identified as such. Also when saving the popup is way to small and very low on the screen. Make it prominent and centre.
The app works with no issues or glitches. You manually record the blood pressure, can see overall weekly, all period, etc. graph, and email the data in .CSV format. That's it! There is no time-of-the-day statistic, clicking on the particular part of the overall graph for more detailed analysis, etc. Lack of functionality is the reason for 4/5.
Limited. I use a tablet with a keyboard so I need a landscape orientation. Then, the pulse rate records 1 point lower than the entry. There is no way to edit the pulse. This becomes quite tedious when you're trying to enter a month of data for a history record. I uninstalled it because of these issues.
was going to only give 4 star because of the inability to change the colors to something easier to read. The colors selected make it difficult and most people who are keeping an eye on their blood pressure are usually the aging population but not the apps fault I can't see :) maybe in the history the numbers were black instead of white.. just a thought
Very helpful app and looks nice too! Would like to see a graph that also includes the day they were taken within the graph, maybe designate with lines or color? Also, the nice shading under the readings should possibly reflex high or low readings. These are only suggestions and I really think your app is great!! Could there be a version that is paid to remove ads?
I wouldn't say that the ads are "disruptive" but they are large. I wish there was a app upgrade for paying customers that included a "dark mode." However, it's easy to pick up without reading the manual and I am really enjoying it's simple and uncomplicated interface! Well done guys
Awesome app. I love that it keeps record, lets us put notes in, keeps a chart and a graph of the most recent readings, even my doctor liked the fact that the readings are color coordinated for normal, prehypertension, stage 1, and stage 2, all have different colors, I love that I don't have to keep up with paperwork, the app does it all for me. The only con I see is that some of the prehypertension readings could be normal range, but the app clarifies normal from 120/80 which is good.
When I give an app a rating I have never given a written review but in this case I will...this is an amazing app. Very easy to use. Some one mentiones that you could not share data however you can if you go to the last page and enter an email address it sends a PDF of the info..the only suggestion I would make is the PDF I just one continuous line of text, if It could be seperated by date it would be easier to read. Awesome app otherwise!
This would be a 5-star app if there was a way to turn off the ads. I understand that some users prefer free with ads but I prefer a reasonable purchase or subscription fee to be ad-free. The app is excellent except for the annoyance of the ads, especially as there is no way I would ever join Facebook and that is the ad I see most often.
It's really helpful to record everything, to export the data and to see trends. It's been easy to get used to and editing when I first started when I made mistakes in using it were easy to do. Also, I could add in older readings manually to increase the opportunity to see trends. Great app.
Perfect app for taking my blood pressure. I paid for one a few years ago and they no longer update it. This one does everything the other one does and more and is completely free with no ad's. It does not have profiles but dont need them anyway. I will look at what else they make and consider purchasing just because they took the time to make this so simple and did not load the app with other junk.
Straightforward, but annoying ads. I like the overall app and the layout. I am annoyed it forces ads to be displayed (I firmly believe an app should not be used for advertising, and should limit data collection to the app use, which should not be shared at all) and does not offer an option to pay a small amount for a permanently ad-free version. Get rid of ads (and maintain data not being shared) and I'll make it 5 stars.