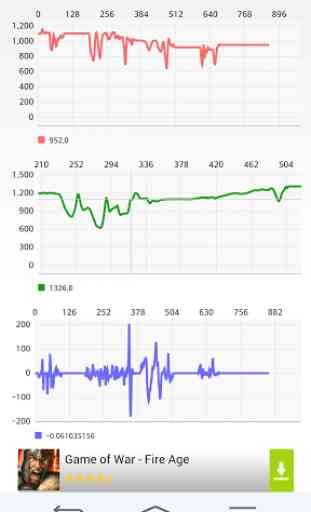
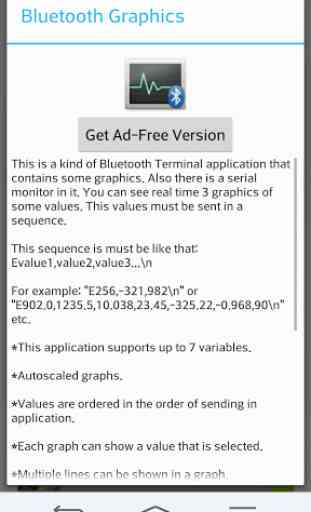
Bluetooth Terminal/Graphics
This sequence must be like that: Evalue1,value2,value3...\n
For example: "E256,-321,982\n" or "E902,1235,10,23,-325,-1240,90\n" etc.
***In Full version, you can see 7 graphs and there are no ads***
Warning: Do not send data too much frequently. If there is lag and freezing in the app when there is data traffic, decrease incoming data frequency.
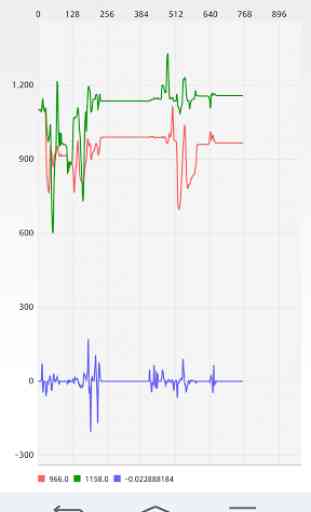
*This application supports up to 7 variables.*You can set graphics' maximum and minimum values.*Autoscaled graphs.*Values are ordered in the order of sending in application.*Each graph can show a value that is selected.*You can set number of graphics that is shown.*Multiple lines can be shown in a graph.*Pinch to zoom both axes in graphs.*Sliding and refreshing graphs.*Data logs can be saved at *ExternalStorage*/BluetoothGraphics/*CurrentTime
* directory*Up to 7 lines in multiple line graph for Full version
MPAndroidChart library is used.
Arduino usage example for serial printing part for 2 values (adc1 and adc2 are example variables):...Serial.print("E");Serial.print(adc1);Serial.print(",");Serial.print(adc2);Serial.print("\n");...
Coming Soon: USB Serial Communication Support for Full versionFor full application: BT Terminal/Graphics Full
Note: If you want a full apk of this application, you can send mail to me. Also, I can make a custom GUI for your projects or works.
Category : Tools
Reviews (21)
This looks great BUT is not working with my HM-10 BLE device even though the device is paired BUT not connecting. Is this not BLE compatible??,
Hii, its working good, but I can not save the logger. Its show error " Directory failed", any body can help?
Great tool for getting and graphing information from the hc-06 serial bluetooth module
Hi there, i have the same problem as Muaz Muttalib, i can't get the data to be represented in the chart, however in the terminal it appears properly. I am also using a xiaomi Mi3. The data i receive is ranged from 0-5 or 0-1023. Integers or floats. If you could help it would be nice! Thanks for this app, it is really useful!
This is a great app got it running very easily even the graph part flawless. All i wanted to ask is if u could add date and time stamps to the terminal or at least the log as this makes it possible to then also use this data on the pc! Also actual time on the graphs would be excellent! Thank u for this great app! Good luck
Good application.To display graph on screen use 0x0A at last instead of "\n". Then it work properly. Thanks for this app. This may be very useful for robot calibration /PI control loop parameter setting using terminal mode and verify action/effect of with graph.
As with others below everything seems to be working except the graph is not displayed on my Nexus 5 running 5.1. Terminal works fine. This is a shame - would otherwise be perfect for my project.
We are analyzing lower back posture by measuring the angle of the spine in two points. The graphs and data logger are very useful. I wish there was a way to save the graphs and analyze data on this app.
can anyone tell me that what type of data has to fed to the application via bluetooth so that the waveform gets displayed. -thank you
The only problem is font are too small in terminal and graph . font size
Im using arduino mini pro and hc-05. Terminal seems to work just fine, but in graph there is no data at all. Im using mi3
Excellent. Both graph and terminal works awesome.
..and yet it can't connect.
Hello, can autoscaling be switched off? I need fixed scaling.
this is a great app.
Now I can analyze my room temperature very easily.
I love this app, it's a very nice to improve my phone, to connect external to transfer my video download,"I love it"
Exactly what I was looking for.
Congratulations on turning out a SERIOUSLY USEFUL programme. If I can just make some suggestions: 1 The input string display at the bottom is utterly redundant, particularly when a terminal screen is included. 2. The output and send section is also redundant, for the same reason 3. Much the same can be said for the value in the graph header, or at least have the ability to omit it. 4. It would be nice to show the maxs as strings i.e. to display a temperature as 40.00 degrees max, multiply by 100 and send the integer but have the max show as "40", not 4000. 5. I would like to be able to configure it to show one, or two, graphs as well. Thank you very much
The app works great! The one thing I wish it had is a way to lock the zoom and scale from resetting to default size when you scroll around the graph.
Kind of works. Just do not require to always add E in the beginning of input. No point for it