Chartist NSE/BSE/MCX + Zerodha
-
1. NSE (National Stock Exchange)
- All Indexes and Stocks2. NSE (FUT) (National Stock Exchange)
- All Indexes and Stocks3. BSE (Bombay Stock Exchange)
- All Indexes and Stocks4. MCX-SX (FUT) (Multi Commodity Exchange)
- All Indexes and Stocks5. MCX-SX (FUT) (Multi Commodity Exchange)
- All Indexes and Stocks
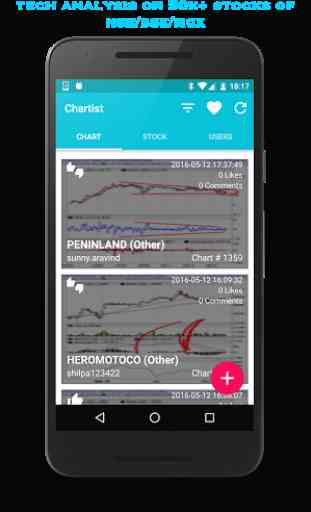
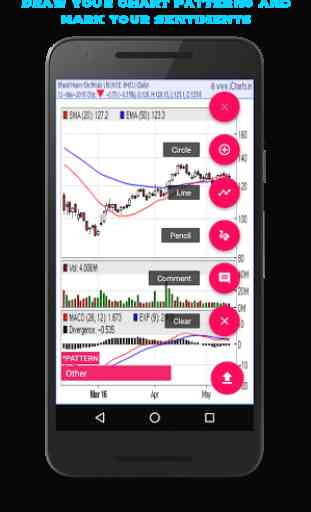
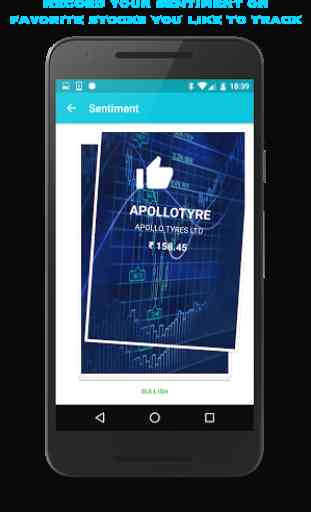
You must have a little bit of background on technical analysis. Or you may prefer to learn on the way. Once you get a feel, you will start seeing a pattern being formed. Please use the drawings to mark those patterns and save the charts for your future reference and also for others to see. At the same time you can view other's analysis and chart patterns of leading stocks and indexes and learn from them. You can also add certain charts to your favorite list which help you learn and understand better about the stock market.
HOW IT WORKS?
1. You can view charts of more than 50000 financial products across STOCKS, FUTURES and INDEXES.2. You can draw on the charts with free hand and save it for future reference.3. You can learn from others doing the same and save their technical analysis as your favorites.
TECHNICAL CHART PATTERNS INCLUDED
The following is an exhaustive list of basic chart patterns that the application supports at the moment
- Reversal
- Double Top,Reversal
- Double Bottom,Reversal
- Head and Shoulders Top,Reversal
- Head and Shoulders Bottom,Reversal
- Falling Wedge,Reversal
- Rising Wedge,Reversal
- Rounding Bottom,Reversal
- Triple Top,Reversal
- Triple Bottom,Reversal
- Bump and Run,Continuation
- Flag, Pennant,Continuation
- Symmetrical Triangle,Continuation
- Ascending Triangle,Continuation
- Descending Triangle,Continuation
- Rectangle,Continuation
- Price Channel,Continuation
- Measured Move ~Bullish,Continuation
- Measured Move ~Bearish,Continuation
- Cup with Handle
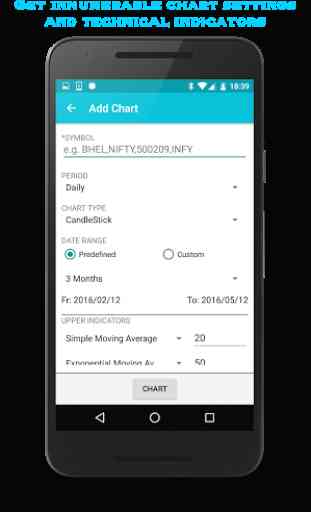
CHART TYPES1. Candlestick2. Lines3. OHLC
TECHNICAL INDICATORS SUPPORTED
UPPER INDICATORSSimple Moving Average,Exponential Moving Average,Weighted Moving Average,Triangular Moving Average,Bollinger Bands,Donchian Channel,Envelop (SMA 20 +/
- 10%),Parabolic Sar
LOWER INDICATORSAccumulation/Distribution,Aroon Oscillator,Aroon Up/Down,Avg Directional Index,Avg True Range,Bollinger Band Width,Chaikin Money Flow,Chaikin, Oscillator,Chaikin Volatility,Close Location Value,Commodity Channel Index,Detrended Price Osc,Donchian Channel Width,Ease of Movement,Fast Stochastic,MACD,Mass Index,Momentum,Money Flow Index,Neg Volume Index,On Balance Volume,Performance,% Price Oscillator,% Volume Oscillator,Pos Volume Index,Price,Volume Trend,Rate of Change,RSI,Slow Stochastic,StochRSI,TRIX,Ultimate Oscillator,Volume,William's %R
Although, this is a pretty exhaustive list, we intend to support more and more chart patterns and technical tools in future. Feel free to suggest and we will be quick to incorporate
DISCLAIMER: Users of Chartist (NSE/BSE/MCX) are supposed to be beginners in finding chart patterns following technical analysis. Their analysis and opinion conveyed are personal. This must not be used for recommendations. Also, we cannot be held responsible for any resulting loss from inaccuracies or via any other means. All information provided via Chartist (NSE/BSE/MCX) must be used for information purpose only and not as investment/financial/research advice.
WE CONNECT YOU TO THE WORLD OF TECHNICAL ANALYSIS! DO CARE TO CONNECT WITH US?
Facebook: https://facebook.com/speculometerTwitter: http://twitter.com/speculometerMobile: +91-7738070123eMail: [email protected]: http://www.speculometer.com
SPECULOMETER :-)
Category : Education
Reviews (27)
Actually it gives error user already exist . But it will allow u to login with same entered details for login. Cheers...
Not able to login. tried many times but no luck
Not working.....and I have try to singnup than told my I have already registered and than I try forgot password so ask mail id and I type mail id but not received mail l.....on the time....
Unable to login many times..
Not able to login
Very informative, thank you
Bad app.. Do not installed
useless.. on that you are asking pay per view.. 😣
Beginners Learning good apps
I am not able login With my Zerodha login .
Don't install waste of time
Waste of time
Bakwas thik se chalta nahi.
Highly informative
Totally time pass
I have paid 100 two time but not showing any where.....and no any reply also.....no balance...no any notification
App is good for presenting view on stocks to the people connected.
Although the app is useful in the sense that you can create a chart and study it on the go with various technical parameters but it seems that the chart becomes public once you save it. I could not find an option to delete the chart once saved. Also could not set an alert for a stock price based on a few technical parameters connected logically apart from only price. Options could have been an advantage. I am even willing to pay if the above features are incorporated. The privacy issue is most concerning. Changed to five stars after you looked after my concerns. Thanks.
This is a place to store your technical views and reconcile later with performance.
No chart in this app
what is your relation with zerodha?
An excellent app for technical charts .
Link with several business apps is astonishing. Grow fast. Blessings.
Thank you
That's very helpful & mostly useful with magnifier thanks
Altough it is better give live scanner of stock
I am having problems for signing up. I have used multiple email addresses but the the app tells that the email already exists. Help please