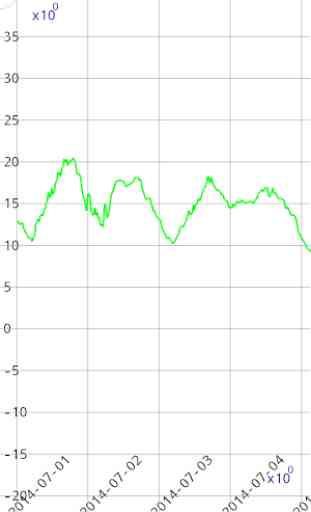
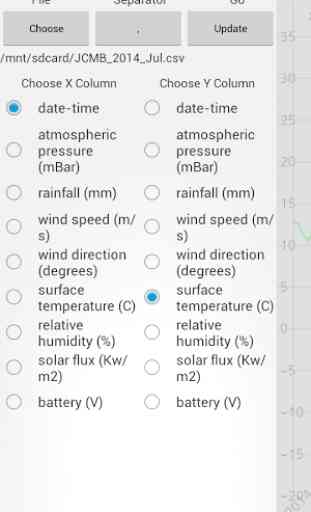
CSV Graph Tool
Consider Installing a file browser on your device. This app will let you pick CSV files directly from the file browser from within CSV Grapher, and via touching a CSV file from your file browser of choice via open with dialog.
- Supports multiple data delimiter (TAB, semicolon, space, and etc...).
- Data is auto sorted based on the X chosen column before plotting
- format auto detected to be either number or date
- Pan and zoom/scale X & Y independently. .
- Very optimized for speed. Browse more than 10K data points smoothly.
If your csv file doesn't work, just email a sample representative of your file and I'll see what I can do to get it working.
If you would like a very custom application. Contact me for custom solutions.
Time Formats
The best date time format to use is the following
yyyy-MM-dd HH:mm:ss Z example: 2014-12-31 23:59:59 -0800yyyy-MM-dd HH:mm:ss example: 2014-12-31 23:59:59yyyy-MM-dd HH:mm example: 2014-12-31 23:59yyyy-MM-dd example: 2014-12-31
There are others that are supported. If you are generating the CSV file and want best support/performance use one of the above as it minimizes ambiguity.
By default the timezone GMT is assumed if not specified. Furthermore the displayed timezone in the graph is GMT. Which means is if your timezones that are specified are not GMT (e.g. your local time) then the graph vertical lines for the days will be when the day changes if it were GMT.
Category : Business
Reviews (17)
Looks good but the date formats are limited, doesn't have a DD-MM-YYYY format so didn't work for my data. No custom format is offered.
Amazing Chart..,simple app for csv data log to display line chart.., I send you emai to bring you into stars, Thanks.
Opened my file and visualized the data. Nice one.
It's a very simple and easy application to work with
It does what it says, and does it very well.
This is exactly what i needed!
Distance between data points on x and y axis should be manually adjustable. Could benefit from a bar graph option.
Please add ability to view actual file name in chart.
Data plotting is simple and effective. No option to save graph
Yup.... Makes a graph. But you can't do anything with it: no share, save, export, print, send... Nothing. What's the point?
Thanks and goodbye. If you have ads, admit it upfront!
Only just installed it but it seems to have a very nice plot viewer and immediately recognized the headers and deliminator. I'll have to see if it can plot multiple sets at a time. It would also be nice if it was able to navigate to my SD card from its file menu (but this could be an issue with my device).
If you add multiple plots in the same view ... Would be great...5stars for sure.. Keep up the good work!!
It reads and displays "vanilla" CSV files. No bells, no wistles. This is what makes a graphing program "profesional" It gets the job done so I can get on with the real work. Now it just needs to plot multiple y axis data
Other programs I tried died trying to import my fairly simple csv memory usage logs or tried to make me re-enter all my data by hand. This only shows one x/y pair at a time, but it's a snap changing what you want to display. No independent x-axis zoom, but it works and it's free, so that's enough! Thanks!
Would not even go to the list of files to open
Default app works better. I wanted to find a graphing program to visually plot a csv file that has eeg data. All I get are a few columns of information, unseparated. Yet another app that comes with my phone titled, "Sheets", separates the data by sensor. But, I am looking to graph this data as a function of time.