FFT
FFT by Studio Six Digital is the first app in the AudioTools series from iOS that is now available for Android.
*** Designed for Acoustical Analysis
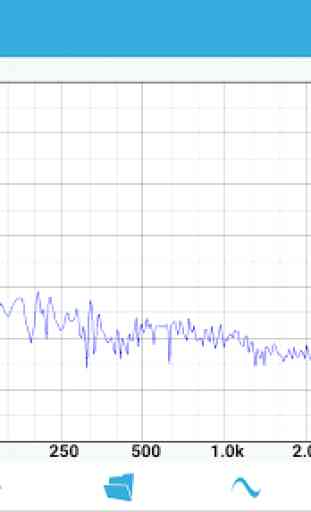
This application has been designed for acoustics work, and so the FFT bins have been normalized to octaves, to get a display that will show a flat line for pink noise. You can control both the level of graph smoothing and decay time, to get as much or as little detail as you require.
You can also control the dB resolution of the graph, as well as the frequency range that is displayed.
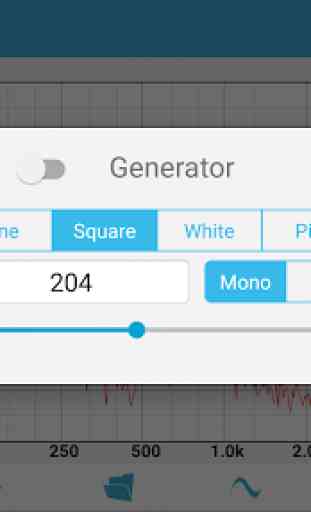
*** Includes Signal Generator
Included in this app is the engine from our Generator app, which is a low-distortion, artifact-free signal generator. The signal generator appears as a heads-up display when you tap the icon, so you can see the graph while you adjust the generator. Generate sine waves, square waves (within limits), white noise, and pink noise, optionally in psuedo-balanced mode. All waveforms are generated in real time using high-precision algorithms.
*** Cursor Readout
Move your finger across the screen to get a cursor to read out exact dB levels and frequencies.
*** Touch-GUI Controls
Use a vertical pinch-open gesture to expand the dB scale.
Use a horizontal pinch-open gesture to expand the frequency scale.
*** Graph Smoothing
Smooth the graph by octave, 1/3, 1/6, 1/12, or 1/24 octave. Adjust the decay time from 0.5 seconds, for a very fast fluid display, to 8 seconds, or use Peak Hold or Average mode. Average mode is a true equal-weighted average, which can run continuously.
*** Peak Tracking
Turn on Peak Tracking to have FFT automatically find a label the frequency of the highest peak on your graph.
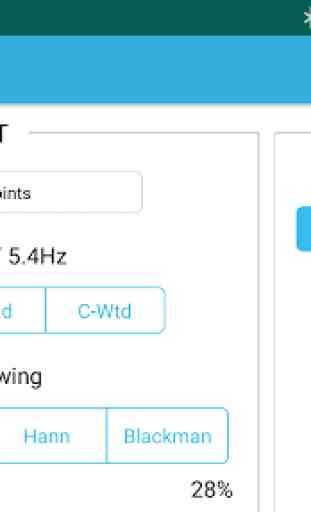
*** Tune the Parameters
Set the FFT size from 4096 to 32k points (depending on Android device) , or select Equal Points Per Octave mode, for high-resolution analysis, even at low frequencies.
*** Save and Recall
When your analysis is complete, you can save the graph image to your photo roll to include in a report, or export the data in an XLS file.
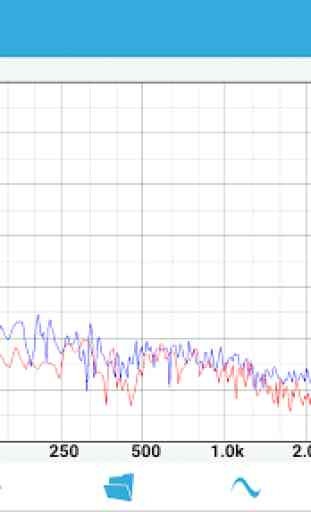
*** Display Multiple Graphs
Show a recalled graph on the screen in a different color.
*** Difference Mode
Use a stored graph as a baseline that is subtracted from the current graph in real time.
**********************************
*** Designed for Acoustical Analysis
This application has been designed for acoustics work, and so the FFT bins have been normalized to octaves, to get a display that will show a flat line for pink noise. You can control both the level of graph smoothing and decay time, to get as much or as little detail as you require.
You can also control the dB resolution of the graph, as well as the frequency range that is displayed.
*** Includes Signal Generator
Included in this app is the engine from our Generator app, which is a low-distortion, artifact-free signal generator. The signal generator appears as a heads-up display when you tap the icon, so you can see the graph while you adjust the generator. Generate sine waves, square waves (within limits), white noise, and pink noise, optionally in psuedo-balanced mode. All waveforms are generated in real time using high-precision algorithms.
*** Cursor Readout
Move your finger across the screen to get a cursor to read out exact dB levels and frequencies.
*** Touch-GUI Controls
Use a vertical pinch-open gesture to expand the dB scale.
Use a horizontal pinch-open gesture to expand the frequency scale.
*** Graph Smoothing
Smooth the graph by octave, 1/3, 1/6, 1/12, or 1/24 octave. Adjust the decay time from 0.5 seconds, for a very fast fluid display, to 8 seconds, or use Peak Hold or Average mode. Average mode is a true equal-weighted average, which can run continuously.
*** Peak Tracking
Turn on Peak Tracking to have FFT automatically find a label the frequency of the highest peak on your graph.
*** Tune the Parameters
Set the FFT size from 4096 to 32k points (depending on Android device) , or select Equal Points Per Octave mode, for high-resolution analysis, even at low frequencies.
*** Save and Recall
When your analysis is complete, you can save the graph image to your photo roll to include in a report, or export the data in an XLS file.
*** Display Multiple Graphs
Show a recalled graph on the screen in a different color.
*** Difference Mode
Use a stored graph as a baseline that is subtracted from the current graph in real time.
**********************************
Category : Tools
Related searches
Reviews (4)
Raj. S.
Jan 14, 2022
It's not working properly, showing an spl graph in the range of 140db, unable to calibrate spl lavel,waste of mone.they don't respond to any query,bad manners
Jos. A.
May 22, 2019
you cant adjust like you can on the iPhone... the iPhone version is infinitely better
Sha. W.
Mar 14, 2022
I'm very glad this app has made it to Android.
The window setting seems to have a bug as the keyboard freezes and jumps between settings. No option to choose log or linear output, only log. Output window also seems to freeze when zooming in and out