G-NetLook Pro
G-NetLook Pro is a tool for visualization and analysis of mobile network.
With it you can open and analyze G-NetTrack logfiles and visualize cells and neighbor relations.
See video demo here -http://www.youtube.com/watch?v=vTaphsm0pOE
With G-NetLook Pro you can open and analyze G-NetTrack logfiles and visualize cells and neighbor relations.
Site data and log data can be loaded from local files or from G-NetWorld web service.http://www.gyokovsolutions.com/G-NetWorld/G-NetWorld.php
---Local data---How to load cell data:1. open the app2. press Menu
- Load Data ( the cell and neighbors files
- cellfile.txt or cellfile.clf and neifile.txt should be located in [SDCARD]/G-NetLook/celldata3. There are two ways to select a cell and visualize its neighbors
- search for cellname
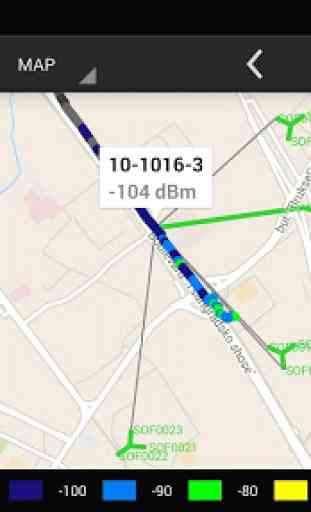
- tap on the middle of cell line or cell label to show info window showing cellname and then tap on the info window.4. On CELL tab you can see cell data and its neighbor cells
How to load log data from logfile:1. Open the app2. Press Menu
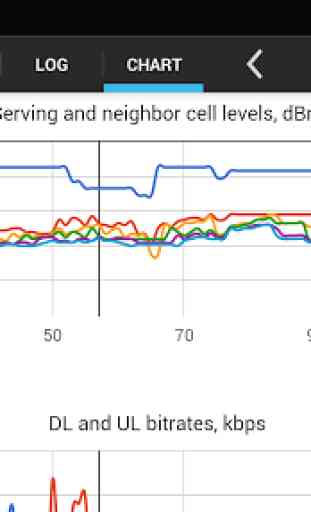
- Load Logfile. Browse to logfile and select it.3. Once the file is loaded you can play, pause or step forward and backward through it with help of navigation buttons.4. Using drop down menu you can change thematic maps (LEVEL, QUAL, CELL, SNR, CQI, DLBITRATE, ULBITRATE, PING, SPEED, ALTITUDE, NEIGHBOR LEVELS etc...)5. On tab LOG you can see the data for selected point.6. On CHART tab you can see charts with measurements. Zoom in/out with the buttons.
---G-NetWorld data---How to load cell data:1. Menu
- Load G-NetWorld Site Data2. Select MCC, MNC and technology3. Press "Load Sites"
How to load logdata:1. Menu
- Load G-NetWorld Log Data2. Select MCC, MNC, technology, start and end date and other criterias3. Press "Load"
Sample data files are copied on first run of the app after installation.If you want you can download sample files for cells and neighbors here:cellfile.txt
- http://www.gyokovsolutions.com/downloads/G-NetLook/cellfile.txtneifile.txt
- http://www.gyokovsolutions.com/downloads/G-NetLook/neifile.txt
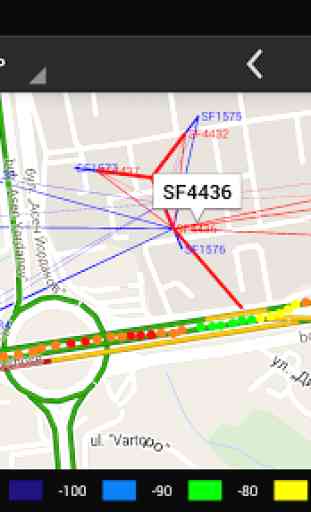
Two types of neighbors are visualized
- outgoing and incoming.
- outgoing
- they are shown as lines starting from end of the cell line
- incoming
- they are shown as lines starting from middle of the cell line
In this way you can check easily if the neighbor relation is reciprocal or only outgoing or incoming.
The color of neighbor line depends on the target cell network type. If it is 2G it is blue, 3G
- red and 4G
- green.
With it you can open and analyze G-NetTrack logfiles and visualize cells and neighbor relations.
See video demo here -http://www.youtube.com/watch?v=vTaphsm0pOE
With G-NetLook Pro you can open and analyze G-NetTrack logfiles and visualize cells and neighbor relations.
Site data and log data can be loaded from local files or from G-NetWorld web service.http://www.gyokovsolutions.com/G-NetWorld/G-NetWorld.php
---Local data---How to load cell data:1. open the app2. press Menu
- Load Data ( the cell and neighbors files
- cellfile.txt or cellfile.clf and neifile.txt should be located in [SDCARD]/G-NetLook/celldata3. There are two ways to select a cell and visualize its neighbors
- search for cellname
- tap on the middle of cell line or cell label to show info window showing cellname and then tap on the info window.4. On CELL tab you can see cell data and its neighbor cells
How to load log data from logfile:1. Open the app2. Press Menu
- Load Logfile. Browse to logfile and select it.3. Once the file is loaded you can play, pause or step forward and backward through it with help of navigation buttons.4. Using drop down menu you can change thematic maps (LEVEL, QUAL, CELL, SNR, CQI, DLBITRATE, ULBITRATE, PING, SPEED, ALTITUDE, NEIGHBOR LEVELS etc...)5. On tab LOG you can see the data for selected point.6. On CHART tab you can see charts with measurements. Zoom in/out with the buttons.
---G-NetWorld data---How to load cell data:1. Menu
- Load G-NetWorld Site Data2. Select MCC, MNC and technology3. Press "Load Sites"
How to load logdata:1. Menu
- Load G-NetWorld Log Data2. Select MCC, MNC, technology, start and end date and other criterias3. Press "Load"
Sample data files are copied on first run of the app after installation.If you want you can download sample files for cells and neighbors here:cellfile.txt
- http://www.gyokovsolutions.com/downloads/G-NetLook/cellfile.txtneifile.txt
- http://www.gyokovsolutions.com/downloads/G-NetLook/neifile.txt
Two types of neighbors are visualized
- outgoing and incoming.
- outgoing
- they are shown as lines starting from end of the cell line
- incoming
- they are shown as lines starting from middle of the cell line
In this way you can check easily if the neighbor relation is reciprocal or only outgoing or incoming.
The color of neighbor line depends on the target cell network type. If it is 2G it is blue, 3G
- red and 4G
- green.
Category : Tools
Related searches
Reviews (5)
And. B.
Jun 15, 2017
Cell id could be in hex
رفي. ف.
Jun 2, 2017
Great, but slow respon. Maybe its too heavy ヾ(〃^∇^)ノ
A. G. u.
Sep 26, 2016
Unique and usefull
kem. i.
Oct 20, 2015
There is a problem to view snr/qual in the map. Please fix the problem.
Great tool