MV Charts 2
ACCESS:
After you install MV Charts you will be asked to REGISTER on http://www.MarketVolume.com web site to RECEIVE USERNAME and PASWORD. This application is a free mobile version of stock charts available at MarketVolume.com. If you already subscribed to any of MarketVolume's services, you may use your MarketVolume's login info to open charts.
During the installation of this app we do not ask for the access to the personal info stored on your mobile device, our app need internet access only. Privacy of our customers is very important to us. However, in order to have ability to access stock market data, customize charts, synchronize charts with java chart version on your computer, save chart’s settings, drawings and alerts, the registration on our main www.MarketVolume.com web site is required.
This app is completely synchronized with charts on MarketVolume.com. You will be able to see on the Java charts on the web site from your home or office whatever analysis you did and saved on these charts. Respectfully, everything that you did and saved on the web site’s java charts, you will be able to access from your mobile device via this app. In this way you can monitor and analyse stocks and indexes from any place at any time.
MAIN FEATURES:
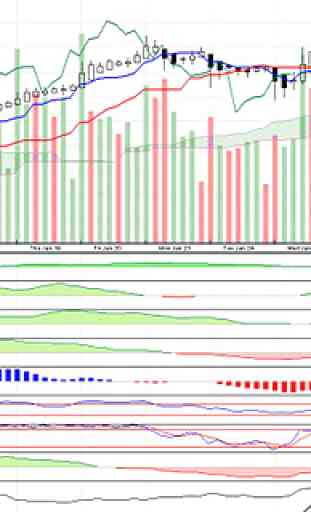
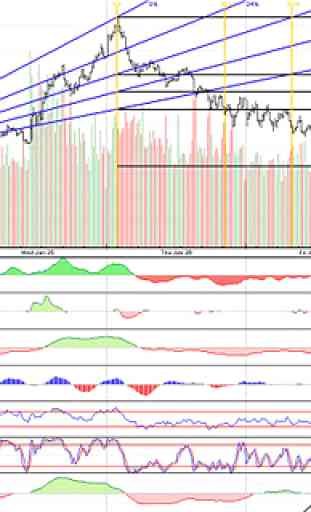
With our charts you will a have access to
- more than 150 popular technical studies;
- more than 50 proprietary technical indicators;
- Selling and Buying Volume (SBV) indicators;
- group of Volatility adjusted Indicators;
- group of Momentum Breadth Indicators for indexes and Exchanges;
- intraday (down to 1-minute bars) volume charts for indexes and Exchanges;
- intraday advance decline charts (including AD volume charts) for indexes and Exchanges;
- various view period, from 1-minute charts up to the daily, weekly and monthly;
- full set of volume indicators (Accumulation/Distribution, Chaikin Oscillator, OBV, Money flow and etc);
- full set of advance/decline indicators (advance/decline line, TRIN, McClellan Oscillator and etc);
- different views, from bars and lines to traditional candlesticks, Heikin-Ashi candlesticks and etc;
- saving chart styles for future references;
- advance system of sound and email alerts which could be set to any indicator and which allows to be notified when a signal is generated;
- ability to see drawings and notes;
- Zoom In/Out function which allows to adjust bar’s size to your screen;
- Scroll Back in history allows you to go back in history;
- you may customize charts on white or black background;
- and much more.
Category : Finance
Reviews (18)
Beautiful colors. Pleasing to look at
No Indian market support though app is good. Request developers to support Indian markets.
Stock market at all SEA country missing!!!
No thanks!
So far the best stock charting app for technical analysis. The only minus is that it require registration on their Website. The nice thing is that the charts are completely synchronize with similar charts on PC. This is the main reason I am going to stuck with this app.
Love the app, works great. I was using a Droid DNA, butjust switched to the Galaxy S5. My old phone had a button that popped up at the bottom to change settings, S5 does not have this tool for this app. The S5 also does not allow me to exit out of studies. Is there a way to correct this?
Looks great on my Galaxy Note. Love black background. Would be nice to have a pen feature and be able to write notes. At this point you can make notes on PC and save - you will see it on the tablet but no edit.
Reliable and complete stock market app. Is very cool, but the design need to be improved. Is for me, the mos complete service on google play market.
This is what I needed! It's great for on the go analysis for stocks. I like the ability to have different displays, customized views, etc. Very impressed!
This is not for everyone, it's very complex and complete. Tons of information and features. Highly recommended!
lame trial
Tested on the Oracle VM Virtual Box with Android 4.3. Works smooth, I like it.
First of all, I love your charts and service, and the android app has been great for on the go access. However the new update is not displaying any declining candles for me. They are simply lines with no candle. I am using a galaxy nexus running android 4.2.2. Thanks for your support!! Recommend the app!
The new finger zoom feature crashes the app. Indicator readings are still illegible w/o a microscope. No easy way to move between bars. It's actually easier to vnc back to my desktop and access the desktop version.
I like that it is tied to my charts on my laptop. Would be nice to be able to draw on mobile version as well
Very advanced charts and very easy to use
Consider removing registration for trial. Couldn't evaluate without registering. Uninstalled immediately.
I use the website and charts on my laptop which are fantastic. The android version on my Samsung Galaxy S10+ are hard to read because it is to small especially on the technical indicators. Is there anyway of zooming in so you can see them better? If not can you update the app so you can?