Spectre FFT
An oscilloscope and spectrum analyzer are included to visualize the data.
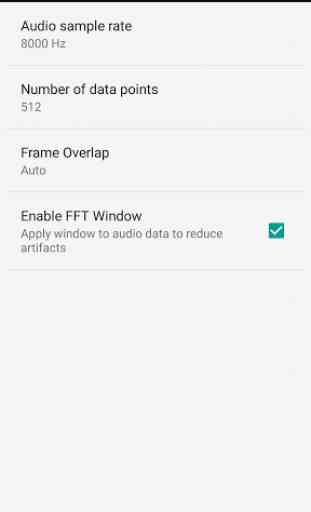
- Audio sample rate from 8000 to 44100 Hz
- FFT size from 128 to 2048
- Optional sliding window: 2 to 8 times overlap
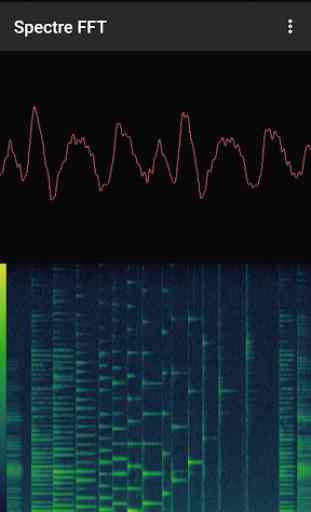
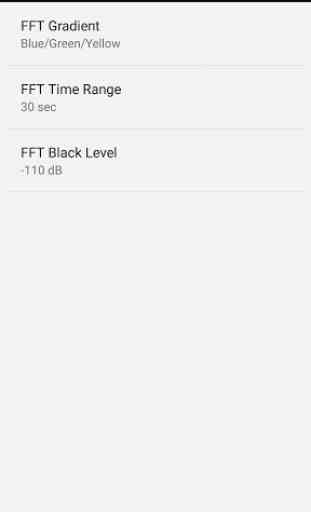
- Selectable gradients with linear luminance
- Spectrogram timespan from 0.5 to 30 seconds
- Black level from -80 to -120 dB
- Tap the screen to pause and restart the displays
Note: internal audio sample rate and quality are limited by Android platform.
A Fast Fourier Transform (FFT) is used to calculate the spectrum of the audio data, breaking the data into multiple frequency bands from 0 Hz to half the sample rate. A higher sample rate will show a larger frequency range, whereas a lower rate will show a smaller range with more detail. The 8000 Hz rate is excellent for viewing voice and low frequency sounds.
The number of frequency bands displayed is half the FFT size. Increasing the size will generate more frequency detail, but reduce time resolution. Smaller FFTs will allow you to see shorter sounds and frequency changes. Keep in mind that your screen resolution will limit how much detail can be shown.
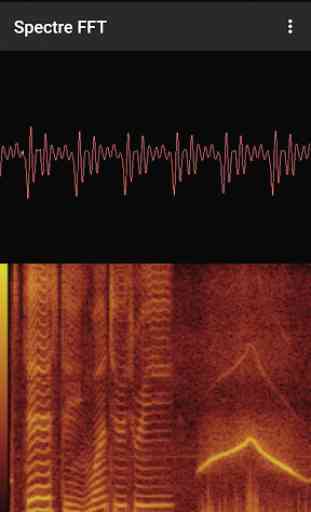
The oscilloscope and spectrum analyzer can be enabled and disabled under the app settings. The scope shows the audio waveform, using triggering (with FFT size over 1024) to produce standing waves. The spectrum analyzer shows the frequency data
- low to high frequency from left to right.
Spectrogram data is drawn vertically
- low to high frequency from bottom to top. Color gradients are used to represent the intensity of each frequency band. The spectrogram is drawn from left to right as time passes, wrapping to the start when it reaches the edge of the screen. The time span can be selected in the app settings.
Frequency data can be displayed with a linear or logarithmic scale. The linear scale shows more detail and aids harmonic analysis, whereas the logarithmic scale better represents how we hear.
It is highly recommended to keep the FFT Window feature enabled, as this prevents frequency artifacts due to sampling the audio data in blocks.
The frame overlap setting increases the time resolution by calculating multiple FFTs as the audio data is received. This is especially useful when using low sample rates or large FFTs, where there are significant delays before the audio data is available. An "Auto" setting adjusts the overlap to maintain an FFT rate of around 50 per second.
A warning is shown if the application cannot keep up with the incoming audio data. This may happen if you are using large FFTs and/or large frame overlaps. Reducing either of these settings should fix the issue.
The display black level setting is used to control how much detail is shown for quiet sounds. A lower value will cause more noise to be visible, but allows very faint signals to be detected.
Category : Music & Audio
Reviews (12)
unique is this can analyze the internal audio, which is very useful as it help me see in realtime the spectrum of the music i am playing on my android. please update: add lines and labels of the frequencies, e.g. 20, 100, 1k, 2k hz
Amazing! I was just interested in the signal and spectrum though. I would add the option to hide the spectrogram.
No listing of actual frequencies on scale. Not many settings and no settable thresholds on waterfall.
Looool liked it
Works great until the day it decides it doesn't want to do anything. Only fix seems to be reinstalling the app. Force stop does absolutely nothing for it.
Whilst this app seems great, it also doesn't work on my phone, crashing instantly when I try to open it.
Currently the best spectrogram on the app store. Works well on LG G3 running Android Marshmallow.
interesting. is it possible to add mp3/wav spectrogram analysis?
It launches, but can't find the phones mic on both phones I tried it on. Of the half dozen or so of spectrogram apps I've tried, this is the only one that seems to have this problem.
The best for spectrel analysis. It contains all the features for free. Keep it up dear.
Does it what the on says tin.
One of my favorite go too apps when using for visuals while adjusting various sound levels using a Hz generated app. can you consider adding HZ frequency section allowing users to freely adjust an play with the levels so we can see the wave variations? IF confused about what I'm suggesting look up the app, frequency generator. Also, 4 Star because no option to record an edit and poor tutorial instructions. But is still a wonderful app! Thank you.