Statistical Quality Control
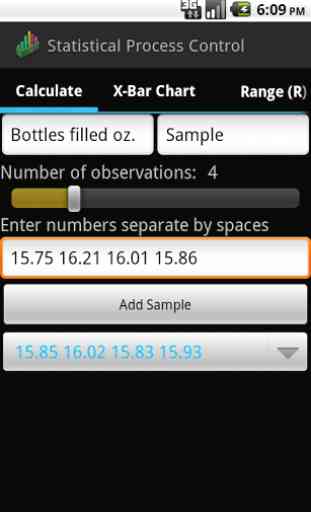
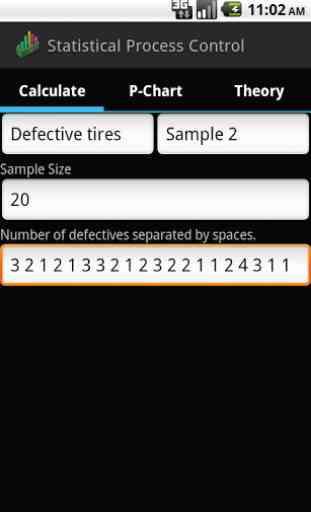
All you need to do is to enter numbers separated by spaces and see the results immediately.
List of features:
- X-Bar Chart
- Range (R) Chart
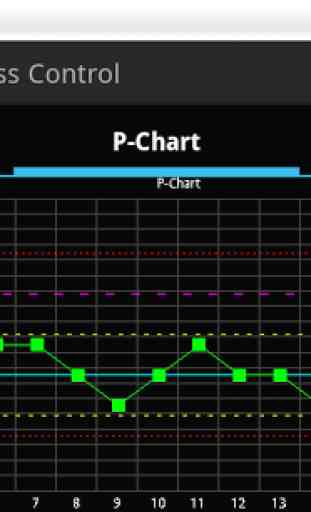
- P-Chart
- C-Chart
- Process Capability, Cp, Cpk
- Theory and examples.
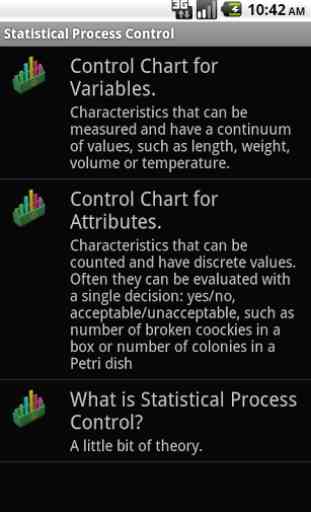
Statistical Process Control is applied in order to monitor and control a process. SPC can be applied to any process where the "conforming product" (product meeting specifications) output can be measured. Applied to Production processes as well as services, Hotels, Restaurants, Banks...
You could study the examples and try to design a method to monitor your production process or service.
Your last data are persistent. You can close and reopen your app and to continue adding data. data will be deleted when you start a new data set.
Your comments will be appreciated and I have the commitment of improve the application with more features.
Category : Education

Reviews (9)
Ridiculous and bad app. Number of observation don't work.
Nearly useless, at least in the free version. Chart labels use a microscopic font that cannot be read, plots can't be saved except by screenshots. MS Excel is both easier amd more accurate. Anyone who finds this "useful" has really low expectations...
I can't change the number of observations in control chat for variables,it stays in 2
I'm studying and working as a quality control,most based in testing and inspection.this app has helped me alots,very usefull
Great app would however like ability to remove or decide sigma limits between 1, 2 or 3 as well as an mr chart.
Love the app. Wouldn't mind seeing box plots and, certainly, larger labels. (First review in December, also 5 stars)
Very cool
What an exceptional app good work


Does not work on latest android