Trendline Charts
What's new on V3.0:
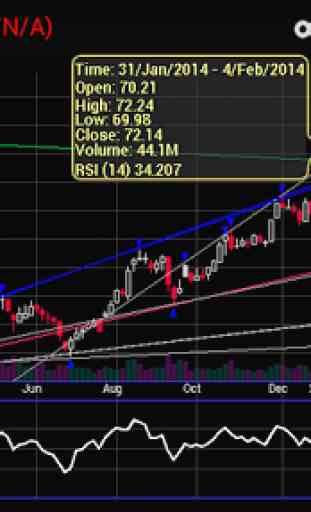
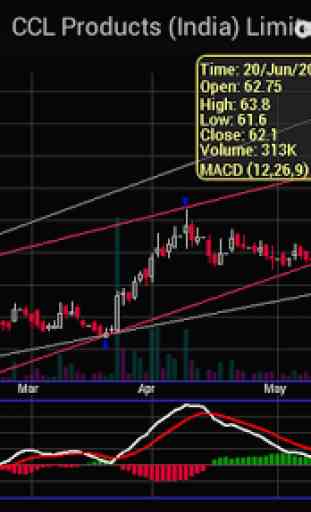
- Interactive Charts, touch info display, scroll, zoom
- Intraday charts and trendlines
- Indicator window: RSI, MACD, SMA, EMA, Bollinger, Keltner, Donchian band, Ichimoku Cloud, Parabolic SAR, McGinley Dynamic, stochastic, ADX, Aroon, Chaikin, Ultimate, MFI, OBV, ATR, ADL, CCI indicators. Fibonacci Retracement and text annotation tools
- FOREX pairs supported
- RSS News feed
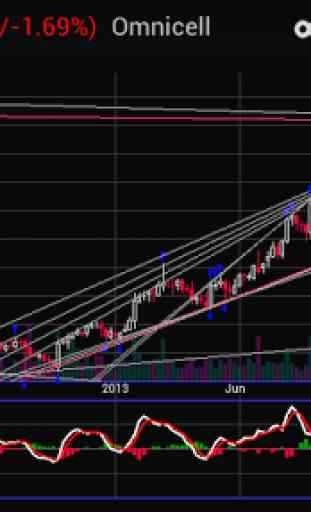
Summary:The only stock chart app to automatically display Support and Resistance lines (also known as Trendlines) on a Candlestick chart, powered by Screenulator.com chart pattern recognition engine. It also has a filter or stock screener based on Trendline patterns, such as Resistance breakout and Support penetration. For example, you can see all the stocks that have broke out resistance levels at a glance.
About Trendlines:A trend line is a bounding line for the price movement of a security. A support trend line (or a bottom line) is formed when a securities price decreases and then rebounds at a pivot point that aligns with at least two previous support pivot points. Similarly a resistance trend line (or a top line) is formed when a securities price increases and then rebounds at a pivot point that aligns with at least two previous resistance pivot points. In other words, bottom lines are formed by joining a series of bottom points, and top lines are formed by joining a series of peaks.
Trendlines are considered by many expert traders and investors as the single most important tools in technical analysis. However, unlike other indicators of Technical Analysis, it does not come with a fixed formula, but require human eyes and brain to draw the best fit line across a series of bottoms or tops. It is still very much of an art form. If you are looking for a particular trendline pattern
- such as Resistance breakout, the tasks of drawing trendlines for all stocks on the market becomes tedious if not impossible. This tool solves the problem for you.
The App lets user select any stock by entering symbol or company name, and shows near real time quotes (synched with Yahoo finance), and draws beautiful candle stick charts with trendlines overlay. Charts can be viewed in many timeframes
- from 3 months to 10 years or maximum lifespan of the stock. Trendline overlays are designed to help you find true trendlines, not the final answer. Some possible trendline candidates may not match your ideal shape, use your intuition to make the best trading decision.
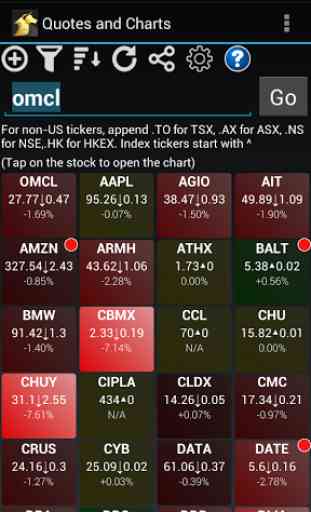
Stock screeners based on trendline patterns include: Resistance (topline) breakout, Support (bottom line) penetration, Channels (both top and bottom line), Wedge (Consolidation pattern bounded by top and bottom lines), near Support level, near Resistance level. The screening results are updated daily and individual stock charts and automatic trendline drawing is done instantaneously in real time.
For non-US tickers, append .TO for TSX, .AX for ASX, .HK for HKEX. Index tickers start with ^
- Candlestick charting for all stocks in 16 markets worldwide, 19000+ symbols
- All Forex pairs
- Supported markets: NASDAQ, NYSE, AMEX, TSX, Asia: HKEX, Australia, New Zealand, India (NSE), JKSE, Shenzhen, Shanghai, Singapore, Europe: London, Paris, Brussels, Amsterdam, Milan, Athens
- Advanced chart pattern recognition engine to display trendlines overlay
- Stock screeners based on trendline patterns, updated daily
- Check out more advanced technical analysis tools at www.Screenulator.com!
Trendline colors: http://www.screenulator.com/cgi-bin/v?pid=faq
Keywords: Stock charts, Trend line, trendlines, automated chart pattern detection
Category : Finance
Reviews (30)
I purchased the Pro version of Trendline Charts back in 2015. Despite the not-so-insignificant cost, I am no longer able to access what I paid for, as this is now a money-grubbing subscription service.
horrible. doesn't even give a trial to use features. Wants you to pay buy in app for trend lines etc.. waste of download. uninstalling.
Historic trendlines' accuracy makes me believe the usefulness and value of the stock technical abaltsis. Amazing tool!
The trend lines are based on historical data - very scientific and objective. It's very helpful for marketing analysis!
I like the unique customizable trendline feature. I learned a lot from the app. Thank you!
I like the customized feature for the trendline charts! Accurate historic database!
Waste app. Don't download it. They are mainly concentrating on money. Asking Subscription for everything. I like to give Zero rating.
Trendines are in sync with the stock market, and have great reference value. I like it!
It is not working at all. Nothing is loading and error messages constantly pop up. T
Trendlines are completely in sync with the stock market, and has great guiding value!
The trendlines have around 85% accuracy as I tested. Great app!
Very useful trendline charts - always referenced. Highly recommended!
The trendlines always help me to search trading targets. Nice app!
Most scientific and reliable trendline app! Love it.
I like the customisable trendlines - accurate and predictable!
Nice stock trend app - accurate, predictabe and profitable!
Scientific statistics design - completely synchronized with stock market trends!
Trendline charts is very reference and valuable!
Just seem to ask for money without showing you anything worth paying for!
Accurate trendline! Greatly help me to analize market! Highly recommended!
Wonderful historical and realtime trendlines!
Great trend charts and excellent customer cervice!
Please don't subscribe it have lots of error s for indian market, I have subscribe waste of money, thanks.
I am happy to use the customized trendline charts!
Accurate trend. Very valuable reference!
I love the customoizable trendline feature!
Accurate trendline charts at a glance!
Good data but horrible colors not worth the eye pain.
Predictable and accurate trendline charts
Brilliant! Works well on ASX Australian tickers! Works well on USA NYSE! Time to ditch my laptop - can do indicator studies on my phone:) Default candles and MACD immediately give more insight than line charts, then you've got an amazing range of both traditional and modern indicators that you can select in Settings:) Too much fun, and seriously good! Android 6.0.1