Vernier Graphical Analysis
- 4.2.2
Use Graphical Analysis to seamlessly collect, analyze, and share sensor data in science and math classrooms. Graphical Analysis facilitates student understanding with real-time graphs of experimental data. Students are able to enhance their lab reports by easily determining statistics, performing curve fits, and adding annotations.
Graphical Analysis, in combination with supported hardware, makes it possible to use your mobile device to collect data from a wide range of Vernier sensors, including temperature, motion, force, pH, and more. You can also collect data from your mobile device’s built in accelerometers or manually enter data into the data table for analysis. Data can be wirelessly streamed to each member of a lab group using the Data Share features of LabQuest 2 or a computer running Logger Pro.
Once data have been collected or entered into Graphical Analysis, students can analyze the data, export data and graphs to create a lab report, or send their finished work to the teacher. Graphs can be exported to Photos, Mail, or note-taking apps, or printed on a printer. A CSV file of the data can be shared with other users or opened in different software, such as a spreadsheet program, for additional analysis.
Key Features
- Data Collection
• Use LabQuest Stream to collect data from up to five sensors simultaneously.
• Collect and analyze data from a Go Wireless sensor or Go Wireless Link and a compatible Vernier sensor.
• Stream data to multiple students from a single source via wireless Data Sharing with LabQuest 2 or Logger Pro.
• Collect acceleration data using your mobile device's built-in accelerometers.
• Collect time-based or event-based data.
• Manually enter data and analyze them using Graphical Analysis.
Key Features
- Data Analysis
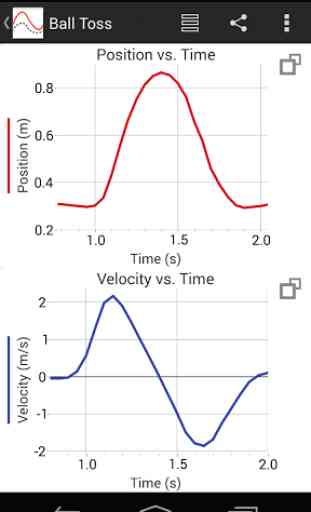
• Display one, two, or three graphs simultaneously.
• View data in a table.
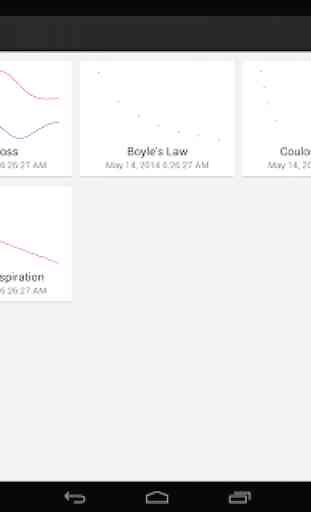
• Edit and auto-save data, graphs, annotations, statistics, and curve fits.
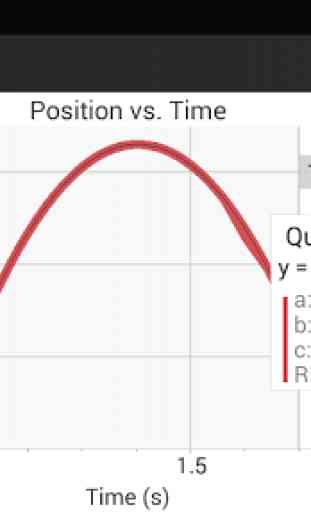
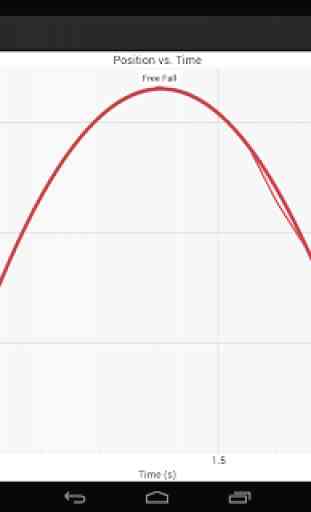
• Draw predictions on a graph.
• Pinch to scale graphs.
• Examine and select data.
• Perform curve fits, including linear, quadratic, natural exponent, and more.
• Create text annotations and add graph titles.
• Export graphs and data.
Vernier Software & Technology has over 30 years of experience in providing effective learning resources for understanding experimental data in science and math classrooms. Graphical Analysis is a part of our extensive line of sensors, interfaces, and data-collection software for science education.
Category : Education
Reviews (21)
Worthless thieving app
It cool and all ig
This app helped me find a wife and kids. I also got a dog, and he's living a healthy life. My chemistry teacher told me to download this, and now my life has changed forever. Thank you so much. You are the best app I have on my phone. I love you.
Tried to use my go temp sensor but it doesnt work with this app at all on my android phone
I just got in 6 LabQuest Streams and fired up the Graphical Analysis app on my Galaxy Note 5. It crashes to the home screen everytime I start a "New Experiment." I tried this with a student's android phone, and got the same result. I used two different students' iPhones, however, and they both worked fine. What's up with that?
It's easy to use and efficient. It would be nice if we could integrate the graph and do some simple operations with the columns.
I only wish that it just possible to do calculated columns, at least with basic features like addition, subtraction, multiplication, and division.
Thank you, vernier. I can sketch graph without the pc version.
Would be great to load and review data from Desktop Logger Pro while mobile. Any plans to allow viewing and import of Logger Pro .cmbl data files.
It graphs only for 10 seconds using the built in accelerometer. I don't know if it is a bug because in iOS works well.
If love to be able to upload data from experiments done from my laptop and I can't find a way to open previously saved cmbl files
This and the companion app both fail due to a low memory fault. Would be a great app otherwise.
I need the regression line to go through the entire graph instead of just the part that I'm able to highlight, also, the regression line is way too thick, otherwise, its a great app.
Since my Galaxy S5 updated to Lollipop I can't connect anymore....😦
Use it to help derive linear physics equations through labs.
Was working fine, now when I try to share data it says "unfortunately, Graphical has stopped" and crashes
Love it!!
It was a totally wast of time I couldn't even see my entire graph and it was not user friendly save your self some time and don't use this app
I have updated my OS for my galaxy s5. The app launches, my phone can see the device, but does not pair... Works well with iPad, however.
If I scan the barcode it disconnect me every time
Could not connect to Go Direct sensors. App is not working properly.