vibration analysis
Explanation of the buttons arranged on top of the screen
CONTI: Continuous measurement
5 SEC: Fixed measurement duration of 5 sec, then STOP automatically
STOP: Stop of measurement, the last 5 seconds are displayed
-: In stop mode, move zoom window (1.28sec) to the left, only for PRO version
+: In stop mode, move zoom window (1.28sec) to the right, only for PRO version
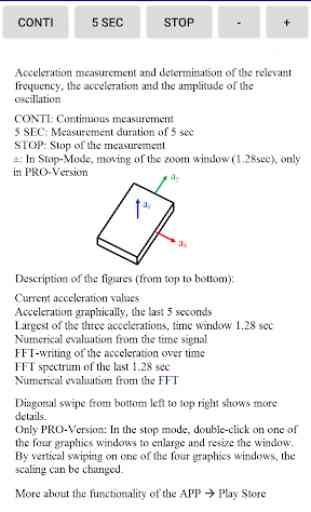
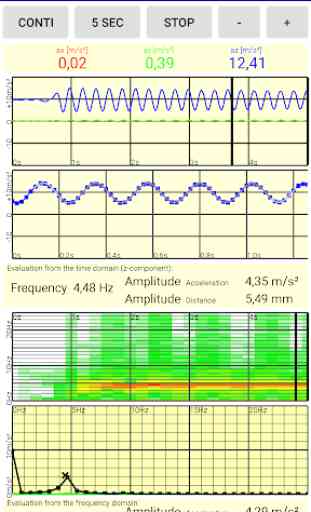
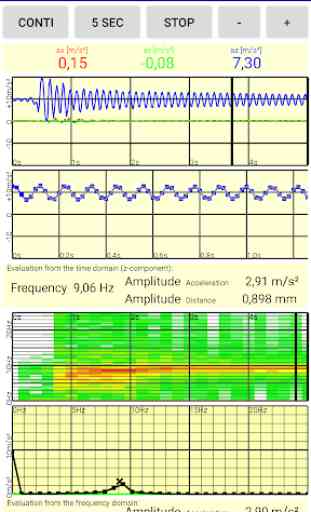
There are seven figures below the buttons.
Upper figure "Current acceleration values":
The accelerations values are displayed. The sampling frequency of most smartphones is 50 Hz. If the actual sampling frequency deviates by ± 1 Hz, then the actual sampling frequency appears (flashing). Different times must then be corrected accordingly. The numerically displayed measured values are corrected automatically.
During a swipe action "from bottom left to top right", the APP goes into a diagnostic mode. Then the actual sampling frequency, the standard deviation of the sampling frequency and an internal counter appear.
Underneath figure "Accelerations over time":
It shows the accelerations curve of the last 5 seconds. After pressing STOP, a window of 1.28 sec is marked (vertical black bars).
in PRO version: the window can be moved by ±, after a double-tap on the figure it appears twice as large, after another double-tip it is resized again. Swipe up, swipe down to change the scaling.
Underneath figure "Largest of the three acceleration components curve":
It shows the acceleration component with the maximum acceleration change. The zoom window is represented by 1.28 sec. It is particularly suitable for oscillation frequencies from 1 Hz to 15 Hz. The more sinusoidal the time signal, the more secure are the determined values. In diagnostic mode, trigger points and sine approximations are visible.
In PRO version: after a double tip on the figure it appears twice as large, after another double-tip it is resized again. Swipe up, swipe down to change the scaling.
Underneath figure "Numerical evaluation from the time signal":
Here evaluations from the time domain are displayed numerically. In the diagnostic mode, the number of detected vibrations are displayed. Sx is their standard deviation. The larger n and smaller Sx, the safer the values determined. The acceleration amplitude also specifies a standard deviation. The calculation is done with the least square method.
Underneath figure "FFT-writing of the acceleration over time":
Here, a plot of the acceleration spectrum over time is shown. Shown are the last 5 seconds. The zoom window is marked.
In PRO version: after a double tip on the figure it appears twice as large, after another double-tip it is resized again. Swipe up, swipe down to change the intensity scale.
Underneath figure "FFT spectrum of the zoom window":
It shows the FFT spectrum within the zoom window. The black curve is the resulting acceleration.
In PRO version: after a double tip on the figure it appears twice as large, after another double-tip it is resized again. Swipe up, swipe down to change the scaling.
Underneath figure "FFT, numeric":
It is the numeric output of the FFT spectrum within the zoom window. The maximum of the FFT is indicated by a cross. Frequency, Amplitude and maximum acceleration values are shown.
Category : Tools
Reviews (14)
I turned it on about 8 minutes ago and now it will not turn off. I noticed that my body inside started vibrating after about 3 minutes of being on. This vibration happens often and is very uncomfortable. I am wondering if it is related to this app. I am also hearing clicking noises in my right ear and I just moved my head to the right and my neck cracked a bunch of times. I am also starting to get sleepy and losing muscle control, especially in my right hand that I'm using to write this. My eyes
Great App. Is it possible to store / save the data, as it is displaying on the screen ? Then, it will be 5 Star. Please look into this option, to store the data, with date time stamp and GPS details.
Frequency range only seems to go to 20Hz, can't seem to change that... not good if you need to know frequencies higher that that therefore!
Very useful to measure the stiffness of bracing in Tall dynamic structure. Good.
Excellent app. even in the free limited version.
Detailed spectral display with numeric analysis. Wonderful.
different info that other apps!
Working very well I liked using it for sometime now sure it's nearest to accurate. Not working at this moment in time (hiccup ) will forward this issue expect I've over used it .Don't let this put you off excellent app I must agree ..I do photo shots too and then add to a chosen file .good luck all 🍀.
This is one of the best real-time frequency display I used so far. Easy to read and understand.
Not accurate , voith oncare is the best
Data that one can use.
how to measure frequency? what is the formulas? do you have some algorithm for this? i want to make vibration analysis using matlab. please help me
It use
The app is excellent, but here I propose a suggestion, Please provide a provision of hiding the plots. Eloboration: actually I require only the frequency domain analysis and the other 3 plots are un necessary to me, so what I feel is if there is a option for stopping the time domain analysis I could get a better ( more sample rate) frequency domain analysis for given system resources. Also please provide an option to evaluate purticular access i.e x or y or z, ( gives better analysis)