Rhapsody 3.0
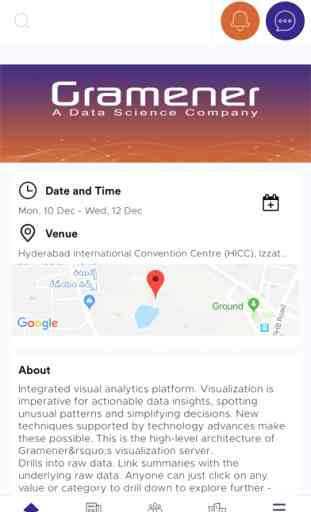
Integrated visual analytics platform. Visualization is imperative for actionable data insights, spotting unusual patterns and simplifying decisions. New techniques supported by technology advances make these possible. This is the high-level architecture of Gramener’s visualization server.
Drills into raw data. Link summaries with the underlying raw data. Anyone can just click on any value or category to drill down to explore further - without limits.
Interactive explorer. Visuals like Sankeys, Cartograms, Voronoi networks, etc. are drawn on the fly. End users can explore models interactively without any statistics knowledge.
Automated narratives. Annotates visuals automatically, explaining insights in plain English. Spots unusual patterns using rules as well as machine learning.
Category : Social Networking
Related searches